TikTok Trends API: Official, Free and Pay-per-Call Routes
TikTok's official APIs have no trends chart. We pulled hashtags and music charts at three times: charts change by edition, hashtag totals every hour.
You may want an endpoint that you can call on a schedule and that returns what is trending on TikTok now. TikTok does not offer one today. On 2026-11-14 we checked all 9 products on the TikTok for Developers site. None of them returns a trending hashtag chart or a trending song chart. The Research API is only for academic and non-profit researchers, and its data is 48 hours to 10 days behind. The Display API reads only the videos of users who give consent.
The Commercial Content API covers only ads in Europe. Creative Center has trend lists, but it is a web page.
Free open-source scripts need a headless browser and a cookie. The most-starred library on GitHub had its last release on 2026-04-01. The remaining route is a pay-per-call API. We used 6 EveryInfra TikTok capabilities and pulled the same hashtags and the same two music charts at three times on 2026-11-14. We then joined these results with the chart snapshots that we made on November 11 and 12 for another article (Viral 50 four times, Top 50 three times).
The repeated pulls show that the platform data itself changes, and that each type of data changes in a different way. The music charts change by edition. Ranks did not move in three rounds on one day. Against the November 12 00:13 edition, 12 songs entered Viral 50 and 34 songs changed rank, so 46 songs changed in total. Hashtag video totals grew at every snapshot. On the first day of El Buen Fin, #buenfin gained 1,071 and 1,222 new videos per hour, and #thanksgiving gained 408 and 344.
The TikTok numbers in this article come from the raw responses of 31 calls. The total cost was $0.0215 for 876 rows. Per capability, the cost was $0.0161 to $0.0463 per 1,000 rows.

Does TikTok have an official trends API?
On 2026-11-14 we opened every product in the footer of the TikTok for Developers site. The footer lists nine products. They are Share Kit, Login Kit, Content Posting API, Research API, Display API, Embed Videos, Data Portability API, Green Screen Kit and Commercial Content API. None of the nine is a trends product. Only three of them read data: Research API, Display API and Commercial Content API. Creative Center, the page where advertisers browse trending hashtags and songs, is a web page and is not in this list.
All quotes below come from pages that we read on 2026-11-14.
Research API: closest to trends, but only for researchers
The Research Tools page says that qualified researchers in the U.S., Europe, Canada and Brazil can apply. They can study public TikTok content and account data. The eligibility list is strict. You must be an academic institution in the U.S., the EEA, the UK, Canada or Switzerland, or a not-for-profit research body in the EU. In Brazil, access is only for academic and not-for-profit groups that study online youth safety. You must be independent of commercial interests, disclose your funding and show an ethical review.

Question 6 of the Research API FAQ is direct: creators, advertisers and commercial users are not eligible. The product page says that TikTok typically replies within 4 weeks. So a brand team or an agency cannot use this route at all. A university lab can, but it must plan for the wait.
After approval, the Research API still has no "trending now" endpoint. The video query works like a SQL WHERE clause. You can filter on fields such as hashtag_name, music_id, region_code, keyword and create_date (Research API getting started guide). One request returns up to 100 videos. The end_date must be no more than 30 days after the start_date (Query Videos reference, last updated 2026-09-01). To see if a hashtag grows, you must count videos per day yourself.
The quota is 1,000 requests and up to 100,000 records per day, and it resets at 12 AM UTC. For freshness, the FAQ says that new videos can take up to 48 hours to enter the search index. Statistics such as view counts can take up to 10 days to update. This is fine for a study of last month. It is too slow for "which hashtag started to rise this afternoon".
The developer changelog shows that the Research API still changes. On 2026-02-26, TikTok changed the data pipeline to cover all public videos, including videos that are not eligible for the For You feed. On 2026-05-21, it added favorites_count to the video queries. EU researchers with vetted status under the Digital Services Act have one more path, but TikTok does not accept direct applications for it. The request must come from Ireland's regulator, Coimisiún na Meán (vetted researcher data access).
Display API: your own users' videos only
The Display API has three endpoints: /v2/user/info/, /v2/video/list/ and /v2/video/query/ (Display API overview, updated 2026-08-04). Its purpose is to show a creator's profile and videos inside your own website or app. Each user must sign in with Login Kit and grant the user.info.basic and video.list scopes (Display API getting started, updated 2026-08-19). One page of video/list holds up to 20 videos (List Videos reference). The API only reads the videos of the user who gave consent. It cannot read other accounts or any hashtag page, so it has no trend data.
Commercial Content API: ads in Europe
The Commercial Content API is an ad transparency tool. Its product page says that you can search ads, advertisers and targeting data. Ad data stays available while the ad runs and for one year after it was last shown. TikTok replies to applications in 1 to 2 weeks (Commercial Content API product page). Coverage is Europe only: the 27 EU countries, Norway, Iceland, Liechtenstein, the UK and Switzerland (Supported Countries, updated 2026-09-01).
The page size is not consistent in the documentation. The getting started guide says the default is 10 and the maximum is 50. The Query Ads reference says the default is 10 and the maximum is also 10. Use this API to see which brands run which ads in Europe. Do not use it to find organic trending hashtags or songs.
Creative Center: a web page with no documented API
Creative Center is the only official page that shows trending hashtags, songs and creators.
On 2026-11-14 we sent a curl request to the old hashtag page, ads.tiktok.com/business/creativecenter/inspiration/popular/hashtag/pc/en. The server answered with a 301 redirect to ads.tiktok.com/creative/creativeCenter/trends. The page title is now "TikTok One Creative Suite". The developer product list does not include Creative Center, and we found no API reference for it. You can read it by hand. You cannot connect it to a scheduled job through an official API.
| Official route | Trends? | Who can apply | Volume | Freshness | Page last updated |
|---|---|---|---|---|---|
| Research API | No chart. Filter by hashtag or music ID and count yourself | Academic bodies in the U.S., EEA, UK, Canada, Switzerland; EU not-for-profits; some Brazil studies. Not commercial users | Up to 100 per request; 1,000 requests and 100,000 records per day | New videos up to 48 h late; stats up to 10 days late | 2026-09-01 |
| Display API | No | Any developer, but each user must grant access | Up to 20 per page; only the user's own videos | Live | 2026-08-19 |
| Commercial Content API | Ads only, no organic trends | Researchers and professionals in any country; 1–2 week review | 10 per request (another page says 50) | Ads stay for one year after last shown | 2026-09-01 |
| Creative Center | Web page with hashtags, songs, creators | Anyone with a browser | No public API | Refreshes on a cycle | 301 checked 2026-11-14 |
Free open-source scripts and where they stop
The four official routes above cost nothing. They stop at eligibility, at freshness or at the lack of an API. The remaining free route is open-source code. GitHub has many unofficial TikTok libraries for Python. The code is free, but you pay with maintenance time. We looked at the most-starred Python library on the tiktok-api topic page on 2026-11-14. It had 6,748 stars and 150 open issues. Its latest release, v7.3.3, came out on 2026-04-01, and its last commit was on 2026-08-24.
One open issue from 2026-07-18 reports "200 empty body response for user-level queries" (issue #1311). When a call returns HTTP 200 with an empty body, a monitor that reads only status codes does not alert. But no new rows arrive in your table. The library also needs a headless browser and a cookie.
We also used the YouTube data API to search for "tiktok trends api python".
From the top 10 results, we chose three videos about TikTok scraping in Python (results 1, 7 and 9) and read their transcripts. This step used 4 more calls and cost $0.0024. These calls are not in the TikTok numbers below.
In the library author's own tutorial, step one is pip install and step two is python -m playwright install, which installs a headless browser. A 2021 tutorial on a TikTok trends dashboard first copies a cookie from the browser. Its author also says that each run returns different results: 10 results became 5 after a date filter, then 3 on the next run. A short video uploaded on 2026-08-28 says that official access is slow and that page scrapers break when TikTok changes its page structure. Its conclusion is that the official API is still the safer choice for commercial use.
There is also a rule to know. The TikTok U.S. Terms of Service were last updated on 2026-07-15. They prohibit automated systems that scrape, crawl, export or extract platform data without written approval from TikTok USDS Joint Venture. We quote the clause as a fact, not as legal advice. Ask a lawyer about your specific use.
Pay-per-call route: six capabilities and what each one does
The third route is a pay-per-call API, the type of "TikTok trending API" that you can call today. You do not log in to TikTok, install a browser or wait for approval. One HTTP request returns structured JSON. At 00:13 Singapore time on 2026-11-14, we read the free EveryInfra catalog. It listed 22 available TikTok capabilities. Six of them are directly useful for trends.
tiktok/hashtag_search finds hashtags for a keyword and gives each hashtag's video count and view count. tiktok/hashtag returns up to 30 videos from one hashtag page. tiktok/music_chart returns a full Top 50 or Viral 50 chart in one call. tiktok/music_search finds songs in the TikTok music library.
tiktok/sound_videos lists videos that use one song. tiktok/search is a keyword video search. We use it to follow the views of single videos by ID.
All six are billed per call. The list price is $0.000556 or $0.000806 per call. Failed calls are not charged.
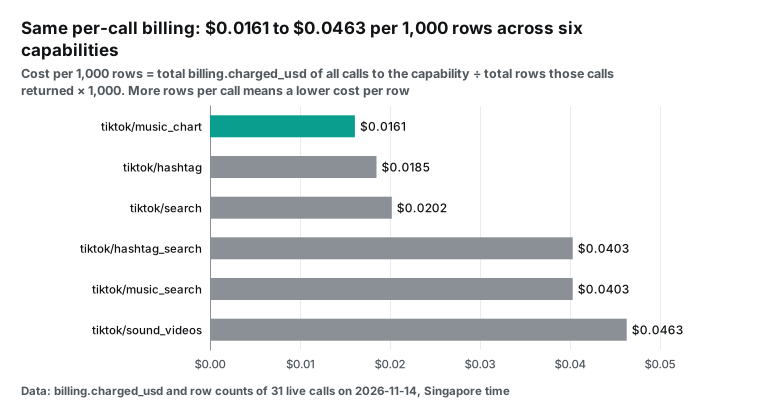
We compute cost from the actual charge and the actual rows, not from the catalog price. With the three rounds and the extra calls, we called these six capabilities 31 times. The billing.charged_usd value of every response equaled the catalog price. The total was $0.0215 for 876 rows.
For each capability, we divide the total charge of all its calls by the total rows that those calls returned, then multiply by 1,000. music_chart is the cheapest: 6 calls returned 300 rows for $0.004836, or $0.0161 per 1,000 rows. sound_videos is the most expensive: 3 calls returned 36 rows for $0.001668, or $0.0463 per 1,000 rows. At the same price per call, the number of rows per call sets the cost per row.
| Capability | Returns | Rows per call (catalog) | Our calls and total rows | Price per call | Per 1,000 rows |
|---|---|---|---|---|---|
hashtag_search | Hashtag name, video count, view count | 20 per page (paged) | 9 calls, 180 rows | $0.000806 | $0.0403 |
hashtag | Videos on the hashtag page | Up to 30 (default 10) | 7 calls, 210 rows | $0.000556 | $0.0185 |
music_chart | Full Top 50 or Viral 50 | Always 50 | 6 calls, 300 rows | $0.000806 | $0.0161 |
music_search | Songs in the music library | 20 per page (paged) | 2 calls, 40 rows | $0.000806 | $0.0403 |
sound_videos | Videos that use one song | Up to 20 per page (paged) | 3 calls, 36 rows | $0.000556 | $0.0463 |
search | Keyword video search | Set by limit (default 10) | 4 calls, 110 rows | $0.000556 | $0.0202 |
The table shows API fees only. For a price comparison of TikTok APIs in general, read TikTok API pricing. For comments, read how to scrape TikTok comments.
What a trend row contains: field guide
The fields decide what you can measure. A hashtag row and a video row are different things. hashtag_search returns hashtags with their totals. hashtag and search return videos with their own counts and post time. music_chart returns songs with rank and usage. The table maps the fields from the catalog's response_fields to the numbers that a trend tracker needs.
| Data | Fields | Meaning | Use it to compute |
|---|---|---|---|
Hashtag (hashtag_search) | hashtag_name, video_count, view_count | Name without #, total videos, total views | New videos and views per hour between two snapshots |
Hashtag (hashtag_search) | next_page_token | Page token, valid for 24 hours | Hashtags after the first 20 |
Video (hashtag, search, sound_videos) | id, posted_at, view_count, like_count, collect_count | Video ID, post time, views, likes, saves | Growth of one video across snapshots, matched by ID |
| Video | hashtags, music | Hashtags on the video; music id, title, is_original | Hashtag co-occurrence and trending sounds |
| Video | is_ad, has_shop_product | Ad flag; TikTok Shop product attached | Separate counts for ads and shoppable videos |
Chart (music_chart) | rank, use_count, released_at, is_commercial | Rank, number of videos that use the song, release date, commercial library flag | Rank change, usage growth, brand-safe music |
The is_commercial flag matters to brand accounts. It tells you if the song is in TikTok's Commercial Music Library, which business accounts can use in their content. The music.is_original flag removes "original sound" entries in one line of code. The 2021 dashboard tutorial spends a full section on that filter.
Pagination, row counts and short pages
The six capabilities page in two ways. hashtag_search, music_search and sound_videos use a page_token. To get the next page, send back the next_page_token from the last response. The token is valid for 24 hours, and each page is one billed call. These three ignore limit, and the platform sets the page size. Hashtags and songs come 20 per page. sound_videos returns up to 20 videos per page, and often 12 or 13.
The catalog adds a warning: a short page does not mean the end. Only a response without next_page_token is the last page. Our sound_videos call at 00:16 returned 12 videos, but it also returned a page token and has_more: true.
hashtag and search use limit. The default is 10 for both, and hashtag returns up to 30 videos. Each call is billed once, and the price per call stays the same when you set a higher limit. music_chart has no pages and always returns the full chart of 50 songs.
One hashtag, three moments: the same calls at three times
On 2026-11-14 we made the same calls with the same parameters in three rounds, at 00:15, 01:16 and 02:17 Singapore time. There was about one hour between rounds. Each round included both music charts and hashtag_search and hashtag for #thanksgiving and #buenfin. It also included search for "thanksgiving recipes" and sound_videos for the song Gangster Bxtch. Rounds 2 and 3 also included "flu shot", a hashtag from outside marketing.
We wrote the pass criteria before the first call. A chart counts as changed when at least 1 song enters or leaves, or at least 3 songs change rank. Per-video growth uses only videos that appear in both rounds, and we report the median. With fewer than 5 such videos, we draw no conclusion. When a hashtag total does not change between rounds, we report it as "no growth".
Music charts: still for hours, then a new edition in two days
On November 11 and 12 we pulled both charts for another article. We pulled Viral 50 four times: at 00:20, 01:35 and 02:45 on November 11 and at 00:13 on November 12, Singapore time. We pulled Top 50 three times: at 00:20 and 02:45 on November 11 and at 00:13 on November 12. We keep these raw responses together with the calls of this article. Between these snapshots, no song entered or left either chart, and no rank changed.
On November 14 at 00:15 we pulled them again. Viral 50 had 12 new songs. Of the 38 remaining songs, 34 changed rank and only 4 kept their rank. Top 50 had 17 new songs. Of the 33 remaining songs, 31 changed rank and only 2 kept their rank.
We pulled them again at 01:16 and 02:17 on the same day. Both charts were the same as at 00:15. No song entered or left, and no rank changed. Only usage grew: 43 and 40 Viral 50 songs had a larger use_count in the two intervals.
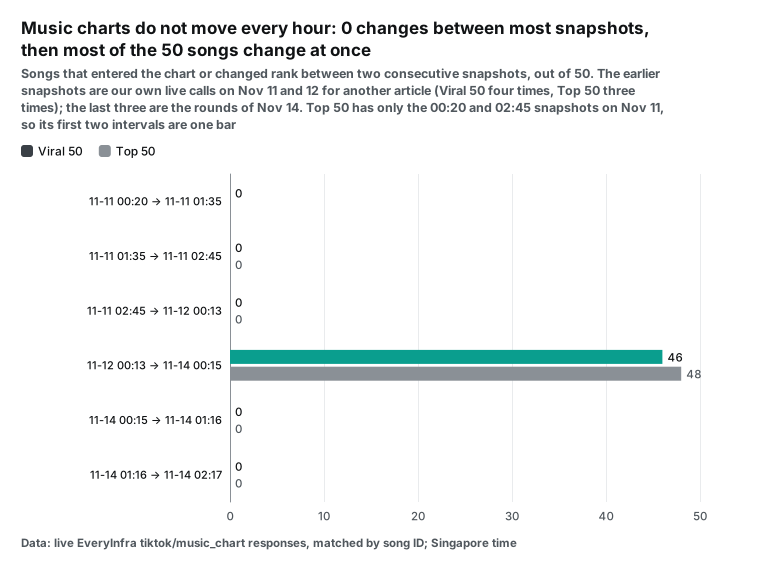
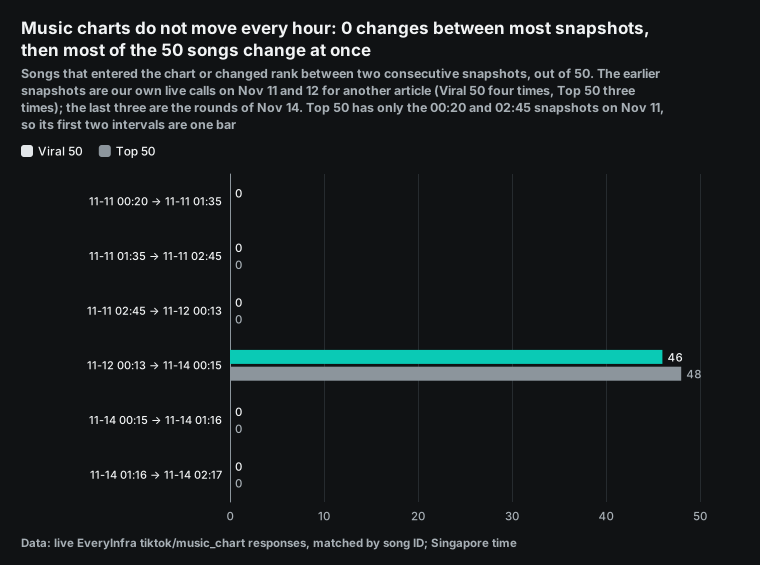
So the charts change edition by edition, not hour by hour. Inside one edition, ranks do not move, but usage still grows. From 00:20 on November 11 to 00:13 on November 12, Housewife stayed at #28 on Viral 50. In the same 23.9 hours, the videos that use it grew from 609,101 to 622,586. That is 13,485 more, or 564 per hour. Gangster Bxtch stayed at #3 and grew from 5,086 to 5,472.
We found no TikTok source that states the refresh schedule, so we report only what we saw. In these days, one new edition arrived between 00:13 on November 12 and 00:15 on November 14. If you track the charts, one pull per day is enough. The value that changes every hour is use_count.
A new edition changes more than the bottom of the chart. The table shows the top 10 of the November 14 Viral 50 edition. For each song, it shows the rank in the November 12 edition and the use_count in the three rounds of November 14. Only Beauty School Dropout kept its place at #4. The other 9 songs moved, and #9, nothing, rose from #29.
| Nov 14 rank | Song | Nov 12 00:13 rank | Uses at Nov 14 00:15 | 01:16 | 02:17 | Change in 2.04 h |
|---|---|---|---|---|---|---|
| 1 | Gangster Bxtch | 3 | 6,534 | 6,638 | 6,747 | +213 |
| 2 | Stolen From Each Other | 6 | 19,160 | 19,223 | 19,292 | +132 |
| 3 | Rechazame | 5 | 134,562 | 134,598 | 134,625 | +63 |
| 4 | Beauty School Dropout | 4 | 20,865 | 20,869 | 20,887 | +22 |
| 5 | Time (2011 Remastered Version) | 2 | 163,650 | 163,661 | 163,693 | +43 |
| 6 | Acting Like You Kanye | 8 | 1,844 | 1,850 | 1,849 | +5 |
| 7 | wonder wander | 13 | 5,557 | 5,566 | 5,566 | +9 |
| 8 | Bounce it | 7 | 425,559 | 425,613 | 425,707 | +148 |
| 9 | nothing | 29 | 91,400 | 91,470 | 91,500 | +100 |
| 10 | Don't You Worry 'Bout A Thing | 14 | 26,644 | 26,648 | 26,655 | +11 |
The new Top 50 edition changed even more. Stolen From Each Other stayed at #1. Gangster Bxtch entered the chart at #2. Housewife fell from #2 to #7, and Last Christmas rose from #15 to #6. The table uses the same columns.
| Nov 14 rank | Song | Nov 12 00:13 rank | Uses at Nov 14 00:15 | 01:16 | 02:18 | Change in 2.04 h |
|---|---|---|---|---|---|---|
| 1 | Stolen From Each Other | 1 | 19,161 | 19,223 | 19,292 | +131 |
| 2 | Gangster Bxtch | New | 6,534 | 6,638 | 6,747 | +213 |
| 3 | nothing | 7 | 91,400 | 91,470 | 91,501 | +101 |
| 4 | the feeling | 8 | 18,178 | 18,190 | 18,204 | +26 |
| 5 | Coming Up Roses | 4 | 235,590 | 235,674 | 235,752 | +162 |
| 6 | Last Christmas | 15 | 672,119 | 672,131 | 672,142 | +23 |
| 7 | Housewife | 2 | 648,964 | 649,540 | 650,083 | +1,119 |
| 8 | Beauty School Dropout | 12 | 20,865 | 20,869 | 20,887 | +22 |
| 9 | All I Want For Christmas Is You | 9 | 16,297,134 | 16,297,542 | 16,297,960 | +826 |
| 10 | Rechazame | 5 | 134,562 | 134,598 | 134,625 | +63 |
In both tables, the songs with the largest usage growth, Housewife and All I Want For Christmas Is You, are not near the top. Holiday songs such as Last Christmas and All I Want For Christmas Is You were already back in the top 10 in mid-November.
12 songs left Viral 50. In the November 12 edition, they included Ramalama (Bang Bang) at #1, Sky at #11 and What Hurts The Most at #12.
New entries are not always new songs. Of the 29 new entries on the two charts, 25 have a release date, and 19 of those 25 came out before 2026. On Viral 50, only 2 of the 11 dated new entries are from 2026, and the oldest is from 2004. On Top 50, 4 of the 14 dated new entries are from 2026, and the oldest is from 1990. So a release date does not tell you if a song is trending.
| Song | Nov 11 00:20 rank / uses | Nov 12 00:13 | Nov 14 00:15 | Change in uses over two days |
|---|---|---|---|---|
| Gangster Bxtch | Viral #3 / 5,086 | #3 / 5,472 | #1 / 6,534 | +1,062 (+19.4%) |
| Ramalama (Bang Bang) | Viral #1 / 857,779 | #1 / 858,204 | Off both charts | 859,203 at 01:19 via music_search: +999 (+0.12%); 859,178 at 02:20 |
| Rechazame | Viral #5 / 133,119 | #5 / 133,485 | #3 / 134,562 | +1,077 (+0.81%) |
| Housewife | Viral #28 / 609,101 | #28 / 622,586 | #33 / 648,960 | +26,374 (+4.24%) |
The ranks stayed still, but usage moved. In the 2.04 hours from round 1 to round 3, 67 of the 77 songs on the two charts had a larger use_count. Dame Hombro grew the most, by 681 videos per hour (0.15%). 8 songs had a smaller use_count. The count drops when videos that use the song are deleted or set to private. Ramalama, which left both charts, also lost 25 videos between 01:19 and 02:20. Do not read one small drop as a change in the trend.
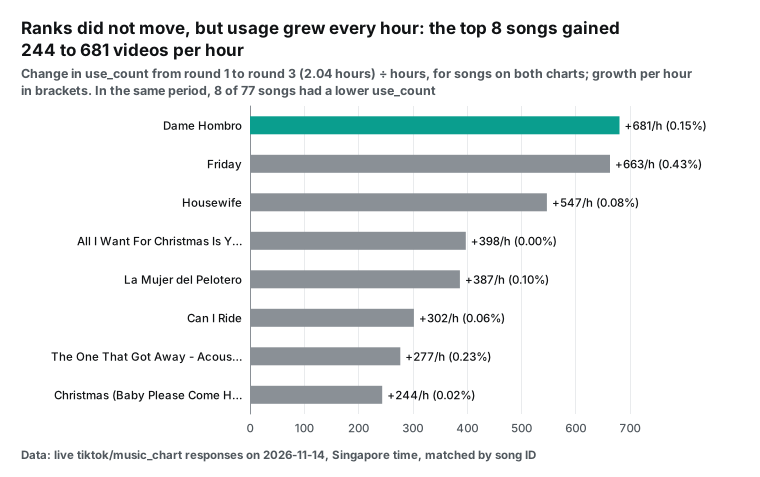
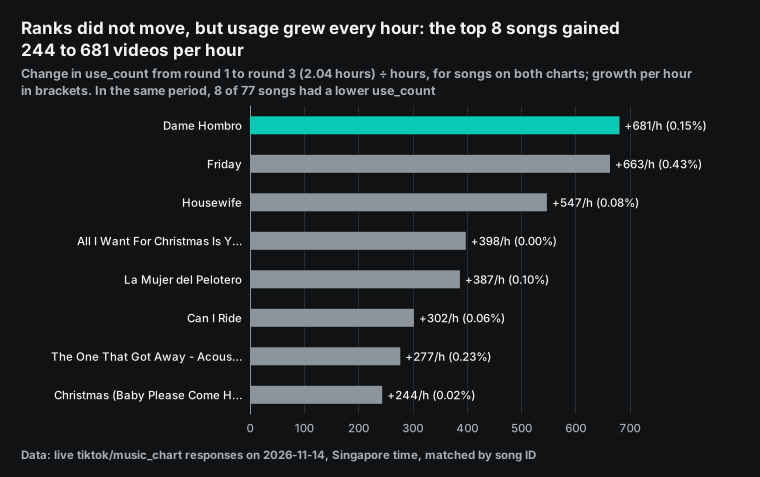
Rank and usage are different things. Only about six thousand videos use Gangster Bxtch, but its usage grew 19% in two days, and it rose to #1 on Viral 50. More than 850,000 videos use Ramalama, and it gained 999 more in two days, but it left both charts. Housewife gained 26,000 videos in two days, but its Viral 50 rank fell from #28 to #33.
For these songs, the Viral 50 rank is closer to the relative growth of use_count than to the total. TikTok does not publish its ranking method, so this is only an observation. When you choose a song, read the rank together with the use_count change. This matches our Instagram Edits trending audio test on November 11. The chart stayed still for a day, but usage kept moving.
Hashtag totals: they grow at every snapshot, and the sales hashtag grows fastest
The music charts stayed still, but the hashtag totals from hashtag_search changed in every round. The table shows the raw values of the two main hashtags in three rounds. The time is the Singapore time of each call. We called each keyword separately, so the times differ by a few minutes.
| Hashtag | Call time | `video_count` | `view_count` | New videos per hour since last call | New views per hour |
|---|---|---|---|---|---|
| #thanksgiving | 00:15:50 | 5,020,838 | 62,909,924,865 | — | — |
| #thanksgiving | 01:17:03 | 5,021,254 | 62,912,371,953 | 408 | About 2.40 million |
| #thanksgiving | 02:18:20 | 5,021,605 | 62,914,954,253 | 344 | About 2.53 million |
| #buenfin | 00:20:02 | 247,285 | 4,283,898,061 | — | — |
| #buenfin | 01:17:59 | 248,319 | 4,286,340,121 | 1,071 | About 2.53 million |
| #buenfin | 02:19:16 | 249,567 | 4,289,165,871 | 1,222 | About 2.77 million |
Neither hashtag had an interval with zero growth, so you can compute growth from the differences. The formula is the difference in video_count ÷ the hours between the two calls. For #buenfin, the first interval gives (248,319 − 247,285) ÷ 0.966 hours ≈ 1,071 videos per hour. The image shows two responses to the same request, at 00:20 and at 02:19. Only the time changed, and the #buenfin video_count went from 247,285 to 249,567.
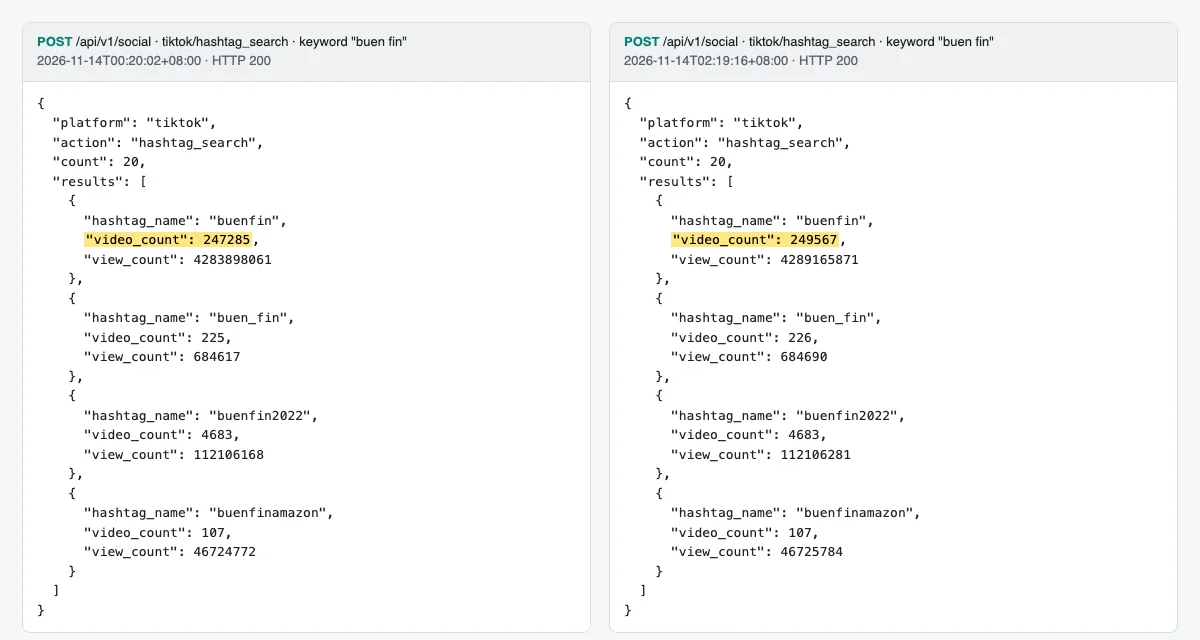
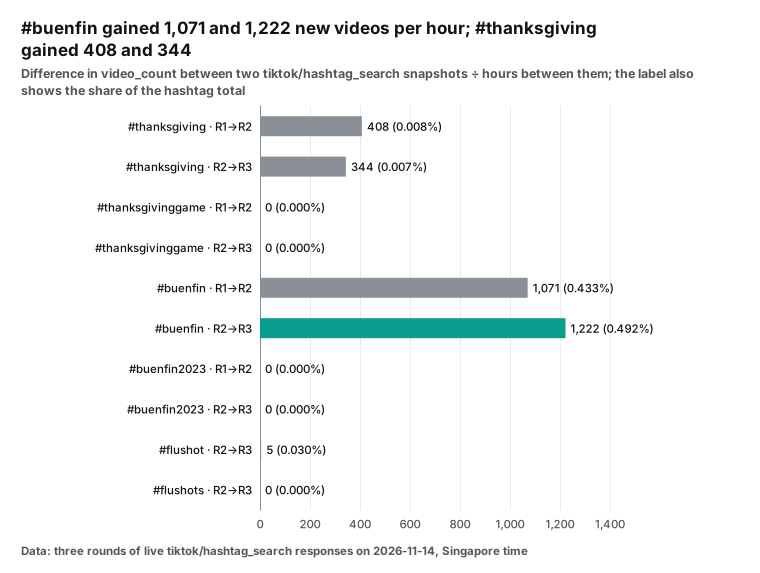
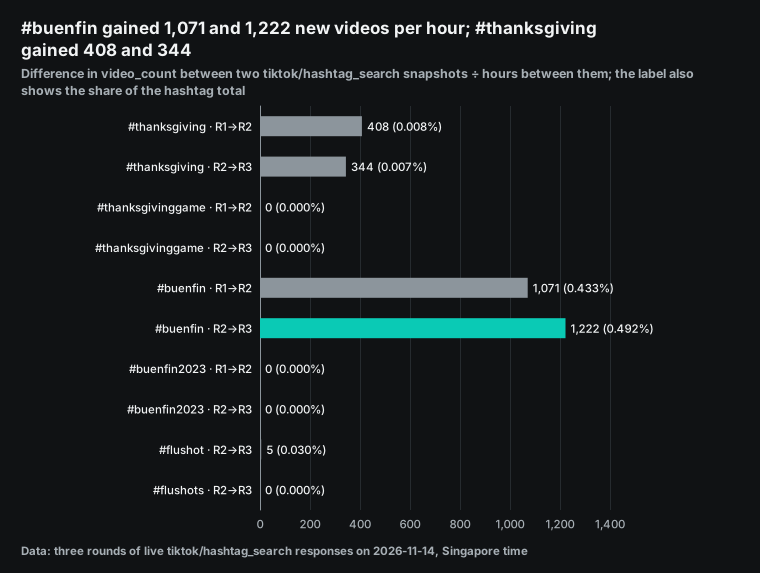
Read view growth and video growth separately. #thanksgiving gained fewer than half as many new videos per hour as #buenfin. But its views grew at about the same rate: about 2.40 and 2.53 million per hour, against 2.53 and 2.77 million for #buenfin. If you divide new views per hour by new videos per hour, #thanksgiving has about 5,900 and 7,400 new views per new video. #buenfin has only about 2,400 and 2,300. A large part of the view growth of a hashtag comes from old videos that people still watch. So view growth cannot replace new videos per hour as a measure of how many people post now.
When you compare two hashtags, say which ratio you use. In new videos per hour, #buenfin had 2.6 times the value of #thanksgiving in the first interval (1,071 ÷ 408) and 3.6 times in the second (1,222 ÷ 344). The two intervals differ a lot, so "about 3 times" is the most that we can say.
As a share of the total (new videos per hour ÷ the previous video_count), #buenfin had 0.433% and 0.492%, and #thanksgiving had 0.0081% and 0.0068%. That ratio is 53 and 72 times. It is large mainly because the totals differ by 20 times. Most of the five million #thanksgiving videos are from past years, and #buenfin has only about two hundred thousand videos. When we pulled the data, it was late morning on November 13 in Mexico City, the first day of El Buen Fin.
The share of the total is more useful inside one group of similar hashtags, where it finds small hashtags that grow fast. On the "buen fin" first page, #ofertasbuenfin had only 2,214 videos. It gained 22.8 and 18.6 videos per hour, or 1.03% and 0.83% of its total. #promocionesbuenfin had only 793 videos. It gained 5.2 and 14.7 videos per hour, or 0.65% and 1.84%.
| Hashtag | Videos at 00:20 | 01:17 | 02:19 | New videos per hour (two intervals) | Share of total per hour |
|---|---|---|---|---|---|
| #buenfin | 247,285 | 248,319 | 249,567 | 1,071 / 1,222 | 0.433% / 0.492% |
| #ofertasbuenfin | 2,214 | 2,236 | 2,255 | 22.8 / 18.6 | 1.03% / 0.83% |
| #promocionesbuenfin | 793 | 798 | 813 | 5.2 / 14.7 | 0.65% / 1.84% |
In absolute numbers they are tiny next to #buenfin. As a share, they grew faster than the 0.43% to 0.49% of #buenfin. Brands and newsrooms often care about this case: the hashtag is still small but grows fast. Let the script make two top-ten lists, by new videos per hour and by share of the total. Read both lists.
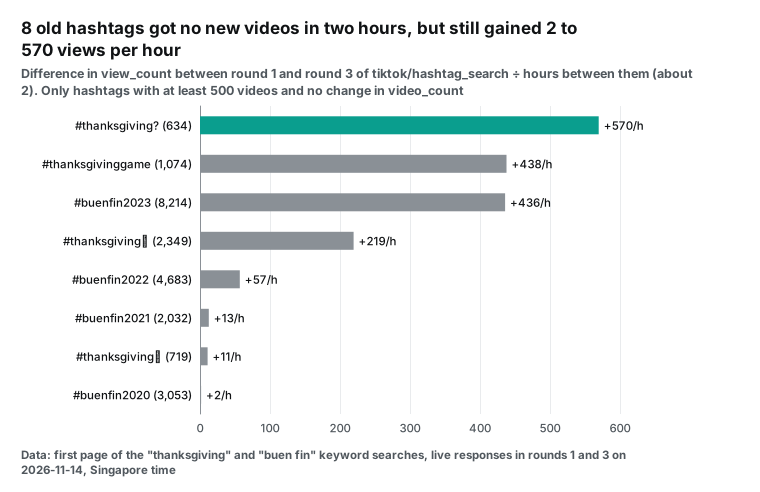
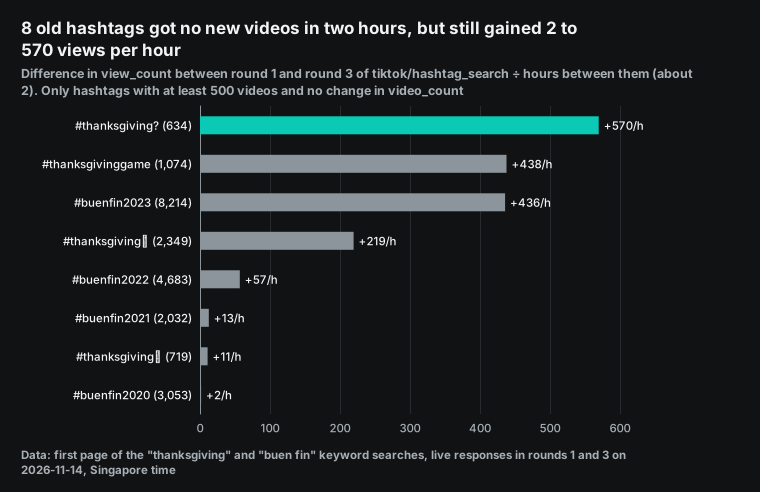
Some hashtags on the same pages gained no new videos in two hours. They are old hashtags with a year in the name (#buenfin2020 to #buenfin2023) and small variants such as #thanksgivinggame and #thanksgiving🦃.
But their views still grew. #thanksgivinggame gained about 438 views per hour, and #buenfin2023 gained about 436. People still watch the old videos in a frozen hashtag. For trend work, the new-video count of these hashtags is 0, so do not treat them as rising. Their view growth only shows that their old videos still get views.
The 30 videos on a hashtag page: the sales hashtag replaced most of them in an hour
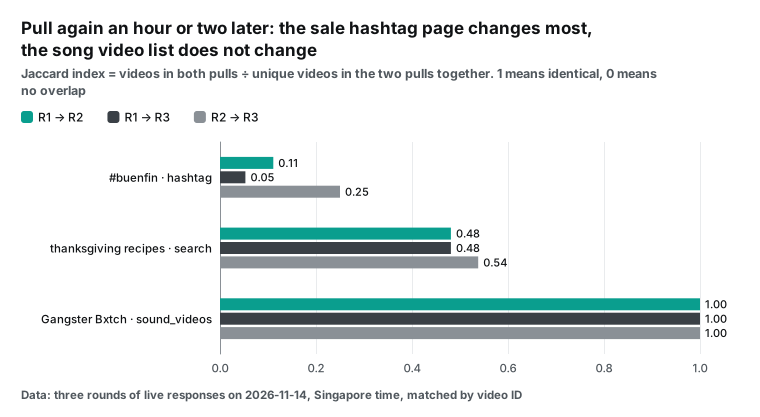
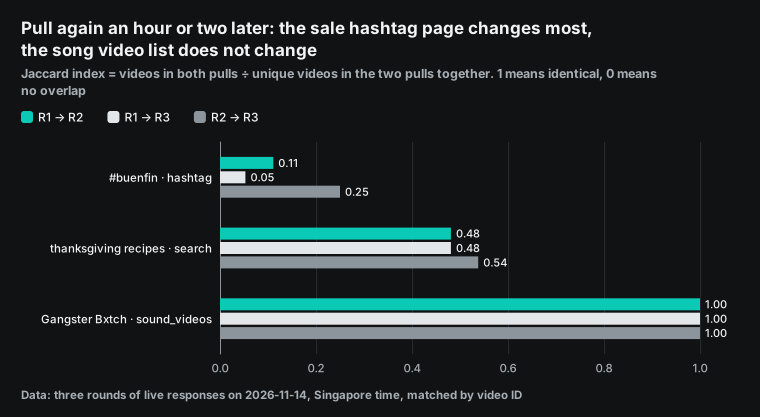
tiktok/hashtag returns 30 videos from the hashtag page. On the first day of El Buen Fin, the #buenfin page changed fast. Only 6 and 12 videos stayed between consecutive rounds, and only 3 of the 30 videos from round 1 were still there in round 3.
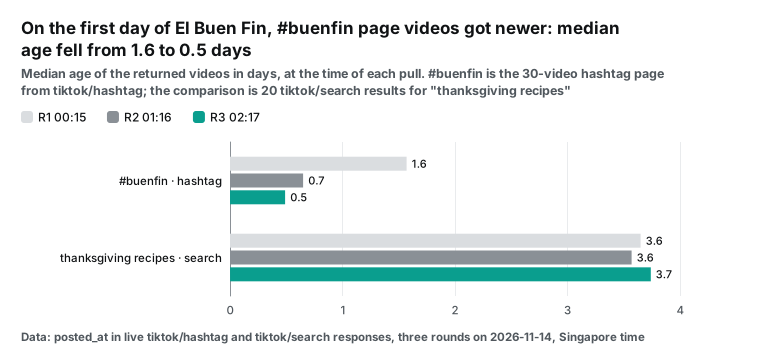
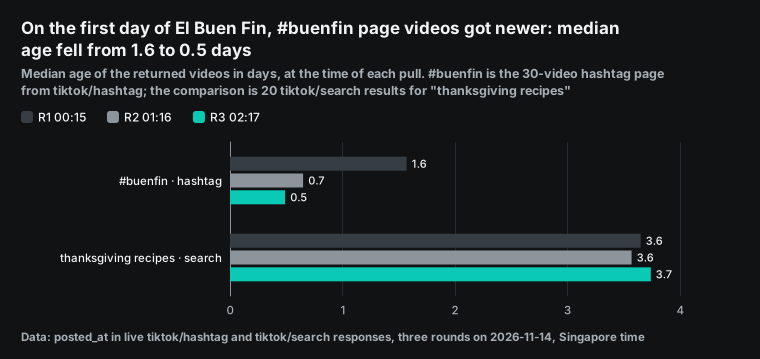
The new videos were posted that day. Of the 30 videos, 14, 24 and 24 were posted within one day in the three rounds. The median age fell from 1.6 days to 0.7 and 0.5 days. The median views on the page fell from 108,700 to 17,450 and 4,646, because most new videos had no time to gain views yet.
Most of these videos use original sound: music.is_original was true for 24, 21 and 23 of the 30 videos. 3, 2 and 2 videos had the ad flag (is_ad). Only one video, in round 1, had a TikTok Shop product attached (has_shop_product). From these fields, few videos on the sales hashtag page sold a product directly on the first day. To count shoppable videos, search for product keywords. Do not count them from the hashtag page only.
The comparison sets changed much less. For the search call on "thanksgiving recipes", 13 and 14 of 20 videos stayed between consecutive rounds. The median age stayed at 3.6 to 3.7 days. The sound_videos call for Gangster Bxtch returned the same 12 videos in all three rounds.
| Returned videos | Median age in days at 00:15 | 01:16 | 02:17 | Posted within one day (three rounds) |
|---|---|---|---|---|
#buenfin · hashtag | 1.6 | 0.7 | 0.5 | 14, 24, 24 (of 30) |
"thanksgiving recipes" · search | 3.6 | 3.6 | 3.7 | 3, 5, 3 (of 20) |
Gangster Bxtch · sound_videos | 10.8 | 10.8 | 10.9 | 0, 0, 0 (of 12) |
This has three direct effects. First, a hashtag page is a window on what people post now. Check it every few hours for new videos. Do not use it as a fixed sample to track the growth of the same videos. To track videos, store the IDs from the first pull. Then get the counts for those IDs later with search or a single-video call.
Second, sound_videos returned the same 12 videos in all three rounds. The video list for one song was stable for hours. To find new videos with a song, read the later pages instead of the first page again.
Third, record the median age of the returned videos at every pull. It is a heat signal in itself. In two hours, the #buenfin median fell from 1.6 days to 0.5 days. This shows that videos from that day were filling the hashtag page.
Single videos: all of them grow, and older videos grow more slowly
We measure per-video growth from the search results. Of the 20 results for "thanksgiving recipes", 13 videos appeared in rounds 1 and 2. 13 of them gained views, with a median of 1,803 new views per hour (0.53% per hour). 14 videos appeared in rounds 2 and 3, and 14 of them gained views, with a median of 2,807 per hour (0.62%). Both samples have more than 5 videos, so by our pre-set rule we can conclude that these videos kept growing for hours.
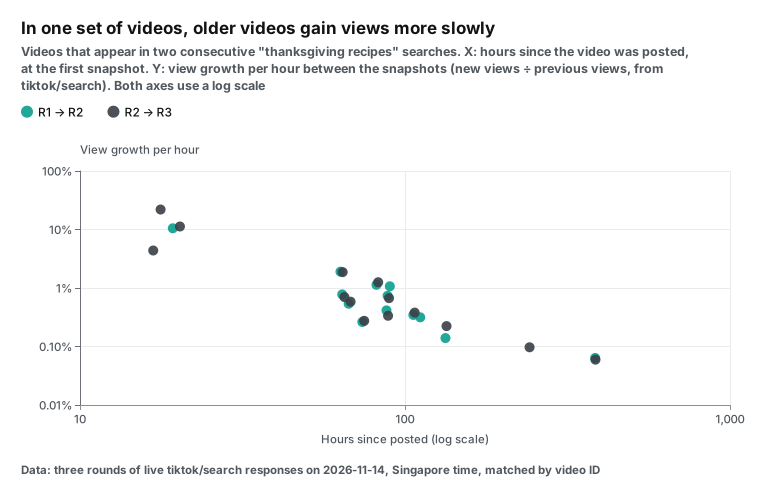
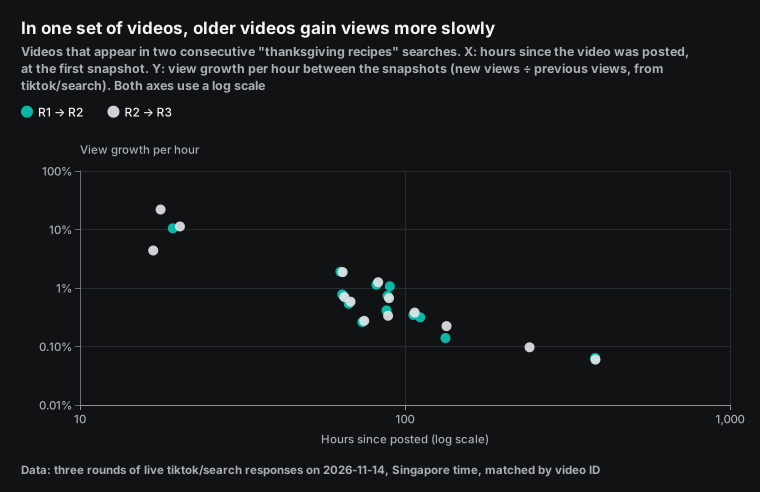
The 4 points for videos less than 2 days old have a median growth of 10.76% per hour. The 20 points for videos 2 to 7 days old have a median of 0.56%. The 3 points for videos more than 7 days old have a median of 0.06%. The rank correlation (Spearman) between age and growth is -0.83. The sample has only 27 points, but the direction is clear.
You can use this as a rule. Under one hashtag, a video that is less than one day old and still grows by several percent per hour represents the hashtag now. Open it and read it. A video that is more than one week old and grows by a fraction of a percent per hour is an old video. Its total views only describe the past.
How to tell that a hashtag is rising: three reading rules
With hourly snapshots in place, the next step is to decide which change counts as a rise. We show each of the three rules below with the values from this test.
First, read the change, not the total. #thanksgiving has more than five million videos and #buenfin has more than two hundred thousand. A comparison of these two totals tells you nothing. #thanksgiving comes back every year, so most of its total is videos from past years.
Compare the new videos between two snapshots, and divide by the hours between them. #buenfin gained 1,071 and 1,222 videos per hour, and #thanksgiving gained 408 and 344. This number, new videos per hour, shows how many people post now.
Second, mark a rise only when at least two signals move in the same direction. You have three signals. The first is new videos per hour from hashtag_search. The second is the share of hashtag page videos that were posted within one day, from posted_at in the hashtag results. The third is the median view growth of single videos from search.
Here is #buenfin. New videos per hour rose from 1,071 to 1,222, and the share of the total rose from 0.433% to 0.492%. On the hashtag page, the videos posted within one day rose from 14 to 24 of 30. Two signals rose together, so you can mark this hashtag as rising.
If only one signal moves, do not mark it yet. The hashtag total can grow while the videos on the hashtag page are several days old. Then people may only be adding the tag to old videos. In the other direction, a few new videos in search can gain views fast while the hashtag total stays flat. Then a few videos may be popular in the feed, but the hashtag has not spread yet.
Third, set the alert threshold above the normal noise of a stable hashtag. #thanksgiving is a stable holiday hashtag. Its two intervals gained 408 and 344 new videos per hour, a 16% difference. #flushot gained only 5 videos between its two snapshots. So a stable hashtag can move by 10% to 20% from one hour to the next, and your threshold must be higher than that. Three rounds cannot set an exact multiple. Run your own hashtags for a few days, find their normal range, and then set the threshold.
How often to pull each item: frequencies from the measurements
Turn the measurements above into a schedule. Pull each item at the speed at which it actually changes. The monthly fees in the table are for 30 days and one hashtag or one chart.
| Data | Capability | Measured change | Suggested frequency | API fees per month |
|---|---|---|---|---|
| Music chart ranks | music_chart | 0 changes inside an edition; one new edition in two days | Once a day | $0.0484 for 2 charts |
| Song usage | music_chart (same response) | Grows every hour, and can drop | With the chart; use music_search once a day for songs you follow | $0.0242 per song |
| Hashtag totals | hashtag_search | Grew at every snapshot; old hashtags did not grow | Every hour | $0.5803 |
| Hashtag page videos | hashtag | #buenfin kept only 6 and 12 of 30 between rounds; the new ones were posted that day | Every hour during sales events, every 3–6 hours otherwise | $0.0667–$0.4003 |
| Views of single videos | search | All videos seen twice gained views | Every hour | $0.4003 |
| Videos for one song | sound_videos | The first page was the same in all three rounds | Once a day, and read later pages for new videos | From $0.0167 |
With this schedule, one hashtag costs $1.16 per month together with both charts once a day. That includes hourly totals and single-video views and a hashtag page every 3 hours. Each day has 24 calls each to hashtag_search and search, 8 calls to hashtag and 1 call to each chart: (24 × $0.000806 + 24 × $0.000556 + 8 × $0.000556 + 2 × $0.000806) × 30 days ≈ $1.1624. Ten hashtags on the same schedule cost $11.19 per month. That is one quarter less than the $14.97 for pulling the three hashtag capabilities and both charts every hour.
One snapshot per hour in Python: hashtags and music charts
All the numbers above come from one script. It does four things. It pulls both music charts and searches hashtags for a keyword. It pulls 30 videos from one hashtag and runs a keyword search for the views of single videos.
It writes the rows to a local SQLite file. On each run, it compares the new snapshot with the previous one. It prints rank changes, new videos per hour, video-set overlap and per-video view growth.
The script needs only requests and Python's built-in sqlite3 module. It reads the key from an environment variable, so the key never sits in the code. By default it waits 7 seconds between calls.
On a 429 response, it waits for the retry_after value and tries again. The script runs on a schedule and retries, so each call sends an Idempotency-Key header and keeps the same value on a retry. Then one request is never charged twice. For the method, read how to add an Idempotency-Key to API calls.
"""Take one snapshot of TikTok trend signals and compare it with the previous one.

Usage:
    export EVERYINFRA_API_KEY=...            # your key, never hard-code it
    python3 tiktok_trends.py --hashtag thanksgiving --keyword "thanksgiving recipes"

Each run stores rows in trends.sqlite and prints what changed since the last run.
"""
import argparse, json, os, sqlite3, statistics, time, uuid, datetime as dt
from pathlib import Path
import requests

API = "https://api.everyinfra.com/api/v1/social"
SGT = dt.timezone(dt.timedelta(hours=8))


def call(platform, action, params, raw_dir=None, tag=""):
    """One POST. Retries on 429 with the same Idempotency-Key; follows poll_url if the job is still running."""
    body = {"platform": platform, "action": action, "params": params}
    headers = {"Authorization": f"Bearer {os.environ['EVERYINFRA_API_KEY']}",
               "Idempotency-Key": str(uuid.uuid4())}  # one key per logical call, reused on retry
    for _ in range(3):
        r = requests.post(API, json=body, headers=headers, timeout=120)
        if r.status_code != 429:
            break
        time.sleep(int(r.json().get("error", {}).get("retry_after", 60)) + 1)
    data = r.json()
    while data.get("status") == "running" and data.get("poll_url"):
        time.sleep(5)
        data = requests.get(data["poll_url"], headers=headers, timeout=60).json()
    if raw_dir:
        Path(raw_dir).mkdir(parents=True, exist_ok=True)
        stamp = dt.datetime.now(SGT).isoformat(timespec="seconds")
        out = {"requested_at_sgt": stamp, "http_status": r.status_code, "request": body, "response": data}
        Path(raw_dir, f"{tag}{action}.json").write_text(json.dumps(out, ensure_ascii=False, indent=1))
    if r.status_code != 200:
        raise RuntimeError(f"{platform}/{action}: HTTP {r.status_code} {data.get('error')}")
    return data


def snapshot(args):
    now = dt.datetime.now(SGT).isoformat(timespec="seconds")
    raw, tag = args.raw_dir, args.tag
    rows = []
    for chart in ("viral50", "top50"):
        res = call("tiktok", "music_chart", {"chart": chart}, raw, f"{tag}{chart}-")
        for x in res["results"]:
            rows.append((now, f"chart:{chart}", x["id"], x.get("title"), x.get("rank"), x.get("use_count"), None))
        time.sleep(args.pause)
    res = call("tiktok", "hashtag_search", {"keyword": args.hashtag}, raw, tag)
    for x in res["results"]:
        rows.append((now, "tag_total", x["hashtag_id"], x["hashtag_name"], None, x.get("video_count"), x.get("view_count")))
    time.sleep(args.pause)
    res = call("tiktok", "hashtag", {"hashtag": args.hashtag, "limit": 30}, raw, tag)
    for i, x in enumerate(res["results"], 1):
        rows.append((now, f"tag_videos:{args.hashtag}", x["id"], x.get("posted_at"), i, x.get("like_count"), x.get("view_count")))
    time.sleep(args.pause)
    # per-video view growth is measured on search results, matched by video ID
    res = call("tiktok", "search", {"keyword": args.keyword, "limit": 20}, raw, tag)
    for i, x in enumerate(res["results"], 1):
        rows.append((now, "search_videos", x["id"], x.get("posted_at"), i, x.get("like_count"), x.get("view_count")))
    return now, rows


def compare(db, now):
    prev = db.execute("SELECT MAX(taken_at) FROM rows WHERE taken_at < ?", (now,)).fetchone()[0]
    if not prev:
        print("first snapshot stored; run again later to see changes")
        return
    hours = (dt.datetime.fromisoformat(now) - dt.datetime.fromisoformat(prev)).total_seconds() / 3600
    print(f"comparing {prev} -> {now} ({hours:.2f} h)")
    q = """SELECT a.kind, a.name, a.rank, b.rank, a.n1, b.n1, a.n2, b.n2 FROM rows a JOIN rows b
           ON a.kind = b.kind AND a.item_id = b.item_id WHERE a.taken_at = ? AND b.taken_at = ?"""
    pairs = list(db.execute(q, (prev, now)))
    for chart in ("chart:viral50", "chart:top50"):
        rows = [p for p in pairs if p[0] == chart]
        moved = sum(1 for p in rows if p[2] != p[3])
        new = db.execute("SELECT COUNT(*) FROM rows WHERE kind=? AND taken_at=?", (chart, now)).fetchone()[0] - len(rows)
        print(f"{chart}: {new} new songs, {moved} rank changes")
        top = sorted(rows, key=lambda p: (p[5] or 0) - (p[4] or 0), reverse=True)[:3]
        for _, name, r0, r1, n0, n1, _, _ in top:
            print(f"  #{r1} {name[:30]:30} uses {n0}->{n1} ({((n1 or 0) - (n0 or 0)) / hours:+.0f}/h)")
    for kind, name, r0, r1, n0, n1, v0, v1 in pairs:
        if kind == "tag_total" and n0 and n1 is not None and n1 != n0 and n0 >= 1000:
            print(f"#{name:27} videos {n0}->{n1} ({(n1 - n0) / hours:+.0f}/h)")
    grow = [(v1 - v0) / hours for kind, _, _, _, _, _, v0, v1 in db.execute(q, (prev, now))
            if kind == "search_videos" and v0 and v1 is not None]
    if grow:
        print(f"search videos seen twice: {len(grow)}, median views/h {statistics.median(grow):+.0f}")
    for (kind,) in db.execute("SELECT DISTINCT kind FROM rows WHERE kind LIKE 'tag_videos:%' OR kind = 'search_videos' ORDER BY kind DESC").fetchall():
        a = {i for (i,) in db.execute("SELECT item_id FROM rows WHERE kind=? AND taken_at=?", (kind, prev))}
        b = {i for (i,) in db.execute("SELECT item_id FROM rows WHERE kind=? AND taken_at=?", (kind, now))}
        if a and b:
            print(f"{kind}: {len(a & b)} of {len(b)} videos also in previous run (Jaccard {len(a & b) / len(a | b):.2f})")


def main():
    p = argparse.ArgumentParser()
    p.add_argument("--hashtag", default="thanksgiving")
    p.add_argument("--keyword", default="thanksgiving recipes")
    p.add_argument("--db", default="trends.sqlite")
    p.add_argument("--raw-dir")
    p.add_argument("--tag", default="")
    p.add_argument("--pause", type=float, default=7.0, help="seconds between calls")
    args = p.parse_args()
    db = sqlite3.connect(args.db)
    db.execute("CREATE TABLE IF NOT EXISTS rows (taken_at, kind, item_id, name, rank, n1, n2)")
    now, rows = snapshot(args)
    db.executemany("INSERT INTO rows VALUES (?,?,?,?,?,?,?)", rows)
    db.commit()
    compare(db, now)


if __name__ == "__main__":
    main()
Put it in cron or any scheduler and run it once per hour, for example 0 * * * * cd ~/tt && python3 tiktok_trends.py. These are the first lines that it printed at 02:17 Singapore time, compared with the run before:
comparing 2026-11-14T01:16:39+08:00 -> 2026-11-14T02:17:55+08:00 (1.02 h)
chart:viral50: 0 new songs, 0 rank changes
  #32 Friday                         uses 155939->156532 (+581/h)
  #33 Housewife                      uses 649539->650076 (+526/h)
  #37 All I Want For Christmas Is Yo uses 16297542->16297959 (+408/h)
chart:top50: 0 new songs, 0 rank changes
  #32 Dame Hombro                    uses 448501->449241 (+725/h)
  #7 Housewife                      uses 649540->650083 (+532/h)
  #9 All I Want For Christmas Is Yo uses 16297542->16297960 (+409/h)
#thanksgiving                videos 5021254->5021605 (+344/h)
search videos seen twice: 14, median views/h +2807
tag_videos:thanksgiving: 0 of 30 videos also in previous run (Jaccard 0.00)
search_videos: 14 of 20 videos also in previous run (Jaccard 0.54)
The script stores and compares. A person or an agent makes the decision. You can change three things. Replace the hashtag and keyword with your own topics. Remove the two chart calls if you do not need music, which saves $0.001612 per run. For longer video lists, raise the search limit. The price per call stays the same.
One real round trip
Every call goes to the same address, POST https://api.everyinfra.com/api/v1/social. The request body has three items: platform, action and params. This is part of the real Viral 50 response from round 1, at 00:15:32 Singapore time. We kept only the first row of results, removed the cover and audio links and kept two billing fields:
{
  "id": "req_be98682e5b1b451b",
  "platform": "tiktok",
  "action": "music_chart",
  "count": 50,
  "results": [
    {
      "rank": 1,
      "id": "7698515848231372806",
      "url": "https://www.tiktok.com/music/Gangster-Bxtch-7698515848231372806",
      "title": "Gangster Bxtch",
      "author_name": "Additup",
      "language": "English",
      "duration_seconds": 55,
      "use_count": 6534,
      "is_commercial": true
    }
  ],
  "billing": { "charged": true, "charged_usd": 0.000806 }
}
The top-level fields of a response are always the same. platform and action repeat the capability that you called. count is the number of rows on the page, and results holds the rows. billing.charged_usd is the amount in USD that the call actually cost, and billing.charged says if the call was charged. Capabilities with pages also return next_page_token and pagination.has_more. Our hashtag_search call at 00:15 returned {"page": 1, "has_more": true} in pagination.
Every response has an async_hint field. It says that you can add "mode": "async" to the request body, get a job_id at once and read the result from GET /api/v1/jobs/{job_id}. Use this mode when a scheduled job must not keep one connection open for a long time.
Cost per 1,000 rows and three monthly budgets
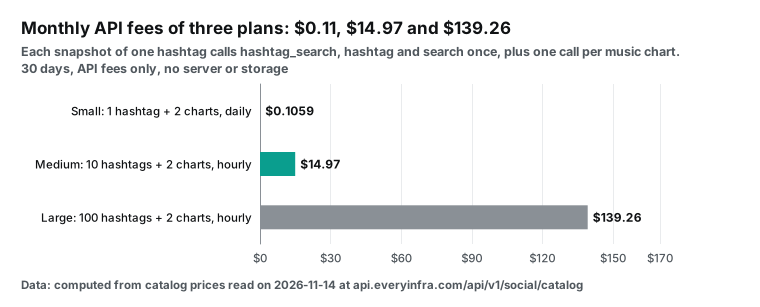
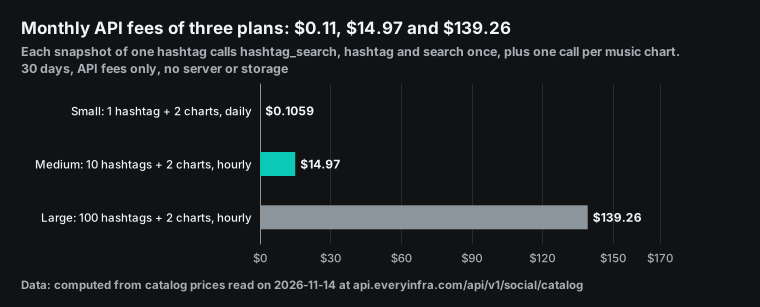
A pay-per-call bill depends only on the number of calls. The table shows the monthly API fees of three plans, at catalog prices from 2026-11-14. hashtag_search and music_chart cost $0.000806 per call, and hashtag and search cost $0.000556 per call. Each snapshot of one hashtag takes three calls (hashtag_search, hashtag and search). Each snapshot of the two music charts takes one call per chart.
| Plan | Calls per month | Rows per month | API fees per month |
|---|---|---|---|
| Small: 1 hashtag + 2 music charts, once a day | 150 | about 5,100 | $0.1059 |
| Medium: 10 hashtags + 2 music charts, every hour | 23,040 | about 576,000 | $14.97 |
| Large: 100 hashtags + 2 music charts, every hour | 217,440 | about 5,112,000 | $139.26 |
This is the same calculation in code. Change the number of hashtags and the frequency to match your plan:
PRICE = {"hashtag_search": 0.000806, "music_chart": 0.000806, "hashtag": 0.000556, "search": 0.000556}
def monthly(topics, runs_per_day, charts=2, days=30):
    per_run = topics * (PRICE["hashtag_search"] + PRICE["hashtag"] + PRICE["search"]) + charts * PRICE["music_chart"]
    return round(per_run * runs_per_day * days, 4)
print(monthly(1, 1), monthly(10, 24), monthly(100, 24))   # 0.1059 14.97 139.26
To spend less, pull each item at the speed at which it changes. Log hashtag totals with hashtag_search every hour. Pull the hashtag video list every 3 to 6 hours on normal days. Pull it every hour only for a hashtag during a sales event. For example, #buenfin kept only 6 and 12 of 30 videos between rounds. Pull the music charts once a day. With these frequencies, ten hashtags and both charts cost $11.19 per month, one quarter less than the $14.97 for hourly pulls of everything.
Connect it to an AI assistant with remote MCP
An AI assistant can call the same six capabilities. The EveryInfra remote MCP server is at https://api.everyinfra.com/mcp and uses a Bearer token. We sent a tools/list request to it on 2026-11-14 at 00:35 Singapore time. It returned 12 tools. Three of them do the data work: everyinfra_list_capabilities (free, lists platforms, capabilities, parameters and prices), everyinfra_call_api (calls any capability) and everyinfra_get_job (reads async results).
Clients that support remote MCP servers, such as Claude Code or Cursor, need one block of configuration. This is a configuration example. Replace the key with your own:
{
  "mcpServers": {
    "everyinfra": {
      "type": "http",
      "url": "https://api.everyinfra.com/mcp",
      "headers": { "Authorization": "Bearer ${EVERYINFRA_API_KEY}" }
    }
  }
}
After that, you can give the assistant a task in plain English. For example: "Every morning at 9, pull the TikTok Viral 50, compare it with yesterday and list the five songs with the fastest usage growth, without original sounds." The model first calls everyinfra_list_capabilities for the tiktok platform. Then it calls everyinfra_call_api with platform: tiktok, action: music_chart and params: {"chart": "viral50"}.
MCP is good for a quick question and a written summary. For a stable hourly log and long comparisons, use the script and a database. A model may not use the same parameters and the same comparison method every time. Send scheduled calls and calls that retry through the REST API. Add an Idempotency-Key header, and keep the same value on a retry. For details, read how to add an Idempotency-Key to API calls. The MCP server page has the full setup steps.
Beyond marketing: newsrooms and public health teams
Brand and commerce teams are not the only teams that watch TikTok hashtags. A Pew Research Center short read from 2026-10-19 reports that one fifth of U.S. adults regularly get news on TikTok, up from 3% in 2020. The Reuters Institute Digital News Report 2026 covers 48 markets. It says that 20% of respondents use TikTok for news, the fastest growth among video networks.
A story can rise on TikTok before it rises in search. A health rumor can spread in short videos before a correction is ready.
The method is the same script with different hashtags. In rounds 2 and 3 we also tried a public health topic.
A hashtag_search call for "flu shot" returned #flushot as the largest hashtag. It had 16,198 videos at 01:19 and 16,203 videos 1.03 hours later (+5), with 13,206 more views.
| Hashtag | Videos at 01:19 | Videos at 02:20 | Views at 01:19 | Views at 02:20 | Change in 1.03 h |
|---|---|---|---|---|---|
| #flushot | 16,198 | 16,203 | 172,627,176 | 172,640,382 | +5 videos, +13,206 views |
| #flushots | 1,501 | 1,501 | 16,607,565 | 16,608,052 | +0 videos, +487 views |
| #flushotseason | 394 | 394 | 4,387,517 | 4,387,572 | +0 videos, +55 views |
The second largest hashtag on that page, #flushots, had 1,501 videos. It gained no new videos in that hour, but it gained 487 views. #flushotseason had 394 videos and gained 55 views. So in this public health topic, only the main hashtag showed that people were posting new content. The view growth of the variants only shows that old videos still get views. Compared with more than a thousand new videos per hour on #buenfin, #flushot is a quiet hashtag, and that makes it a good baseline. If it gains dozens or hundreds of videos per hour one day, check what happened.
A newsroom can log the video counts of a few breaking-news hashtags every hour. When new videos per hour double for several hours in a row, the script can alert the editor on duty. A public health team can put flu, vaccine and medicine hashtags on the same list. Then it can see which claim gains videos and read those videos to judge the content.
The World Health Organization's ethical guidance on social listening sets clear limits. Use public data, prefer aggregate counts over tracking individuals, and confirm every conclusion with human review. The script stores only video IDs, post times and counts, not author names. When you need to read a video, open it by ID. This section describes a data method only. It is not medical advice.
When an official route is the better choice
A pay-per-call API is for "now, every hour, without a review queue". In three cases an official route is a better fit. Qualified academic researchers who need complete historical samples should use the Research API. It filters by date window, region and hashtag and gives 100,000 records per day for free. A study of advertising in Europe needs the Commercial Content API, which has advertisers, run dates, reach and targeting. An app that shows a creator's own videos with consent needs the Display API, which TikTok provides for this purpose.
The pay-per-call route also has limits. It has no full search by region and date window like the Research API. A hashtag call returns 30 videos from the hashtag page at that moment, not every video under the hashtag. It also has no ad targeting or reach data.
Two things to check before production
First, hashtag_search returns hashtags with similar names, and it does not sort them by size. Our search for "thanksgiving" returned 20 hashtags on the first page. The main #thanksgiving hashtag had 5,020,838 videos, but variants with an emoji had from 4 to 2,349 videos on the same page. Sort by video_count or set a minimum before you use the list. The "buen fin" first page looks the same:
| Position on the "buen fin" first page | Hashtag | Videos at 00:20 | Videos at 02:19 | Change in two hours |
|---|---|---|---|---|
| 1 | #buenfin | 247,285 | 249,567 | +2,282 |
| 2 | #buen_fin | 225 | 226 | +1 |
| 9 | #promocionesbuenfin | 793 | 813 | +20 |
| 18 | #ofertasbuenfin | 2,214 | 2,255 | +41 |
| 5 | #buenfin2023 | 8,214 | 8,214 | +0 |
| 3 | #buenfin2022 | 4,683 | 4,683 | +0 |
| 7 | #buenfin2020 | 3,053 | 3,053 | +0 |
| 6 | #buenfin2021 | 2,032 | 2,032 | +0 |
Of the 20 hashtags on that page, only the first 4 in the table changed their video count in two hours. The other 16 did not gain one video, including #buenfin2020 to #buenfin2023 with a year in the name. Remove these frozen hashtags from your watch list, and the list gets much shorter. If you keep them, log only their view growth, and do not treat them as rising.
Second, there is no hashtag chart by country. Of the six capabilities, the music charts and the hashtag data are the single version that the platform returns. They take no country parameter, and the response does not name a region.
Most chart songs are in English, and some are in Spanish. For example, "Rechazame" by Prince Royce is in the top 10 of both charts. This is an observation, not proof that the chart is a U.S. chart. To measure one country, choose keywords and hashtags in the local language, such as #buenfin for Mexico.
Recent changes
| Date | Change and what it means for you |
|---|---|
| 2026-11-14 | The old Creative Center hashtag address returns a 301 redirect to ads.tiktok.com/creative/creativeCenter/trends, and the page title is now "TikTok One Creative Suite". We checked this with curl on that day. Bookmarks, documents and page parsers that use the old address must change. |
| 2026-11-13 | El Buen Fin 2026 started in Mexico. The program rules set it from November 13 to 17, and Profeco helps run it. During these five days, the event pushes up shopping hashtags in Mexico. Do not compare them directly with a normal week. |
| 2026-11-12 | TikTok announced that the in-app competition of LIVE Fest 2026 started on 2026-11-09 and runs to the end of December. During this time, the event pushes up video counts on LIVE-related hashtags. Include the event when you read growth rates. |
| 2026-11-05 | TikTok Shop Germany published the dates of its Black Friday campaign. It runs from November 11 to December 16, with a peak week from November 23 to 30. The same post says that #blackfriday posts from September 16 to October 15 were about 630% above the 30 days before. Do not compare late-November growth on shopping hashtags directly with October. |
| 2026-11-05 | TikTok updated its Get Client Access Token reference. Client access tokens for the Research API and the Commercial Content API are valid for 2 hours (7,200 seconds), and the endpoint returns no refresh token. A long job must request a new token every 2 hours. |
| 2026-10-19 | The Pew Research Center reported that 20% of U.S. adults regularly get news on TikTok, and 39% of adults under 30. Newsrooms have a stronger reason to watch TikTok hashtags. |
| 2026-10-13 | TikTok Shop U.S. announced that its Black Friday and Cyber Monday campaign runs from November 11 to 30. The post also says that #holidayshopping content grew 263% in September compared with the month before. Holiday hashtags such as #thanksgiving will keep growing before Thanksgiving, which is November 26, 2026 on the U.S. federal holiday list. |
FAQ
These questions come from Google autocomplete, which we read on 2026-11-14 with a suggestion tool. The original phrase is at the end of each answer.
Does TikTok have an official trends API? Can I use the Research API or Creative Center?
TikTok for Developers lists 9 products. Three of them read data: the Research API, the Display API and the Commercial Content API. None of the three has a trending hashtag chart or a trending song chart (autocomplete: "does tiktok have an api").
The Research API is free, but you must qualify. Academic institutions in the U.S., the EEA, the UK, Canada or Switzerland can apply, and so can non-profits in the EU. Commercial users cannot apply. The quota is 1,000 requests and 100,000 records per day (autocomplete: "tiktok research api free", "tiktok research api rate limit").
Creative Center has trend lists, but it is a web page, and the developer docs have no API reference for it. On 2026-11-14, its old hashtag page address redirected with a 301 to the new Creative Suite page (autocomplete: "tiktok creative center api").
How do I get trending hashtags from TikTok with an API?
TikTok does not provide a chart. Choose a set of keywords and use tiktok/hashtag_search on a schedule to log video_count and view_count for each hashtag. The difference between two snapshots is the growth per hour. Then use tiktok/hashtag to see what people post under the hashtag (autocomplete: "tiktok api trending hashtags").
How do I get trending sounds from TikTok with an API?
tiktok/music_chart returns the full Top 50 or Viral 50 in one call. Each row has the rank, use_count (the number of videos that use the song) and the release date. To see videos for one song, call tiktok/sound_videos with its music ID (autocomplete: "tiktok trending sounds api", "tiktok trending songs api").
Am I charged when a call fails?
No. Failed calls and empty results are not charged. The billing.charged field of each response says if the call was charged. When it was not, charged_usd is 0 (see the billing section of the docs). All 31 of our calls succeeded, and the billing.charged_usd value of every response matched the catalog price.
How often does TikTok update trending songs?
We found no TikTok source that states the schedule, so we can only report our measurements. Between 00:20 on 2026-11-11 and 00:13 on 2026-11-12, four Viral 50 snapshots and three Top 50 snapshots showed no change. Between 00:13 on 2026-11-12 and 00:15 on 2026-11-14, a new edition arrived: 46 songs on Viral 50 and 48 on Top 50 entered or changed rank. The three rounds on 2026-11-14 again showed no change. At this pace, one chart pull per day is enough. The value that changes every hour is use_count (autocomplete: "how often does tiktok update trending songs").
Can I get TikTok trending hashtags by country?
Creative Center, the official web page, can filter trending hashtags by country, but it has no API. The Research API can filter videos by region_code, but only qualified researchers can use it. In the six pay-per-call capabilities of this article, the music charts and hashtag data have no country filter. The responses do not name a region. To measure heat in one country, choose keywords and hashtags in the local language, such as #buenfin for Mexico. Then log their totals with hashtag_search on a schedule (autocomplete: "tiktok trending hashtags by country").
Get started: from the playground to hourly snapshots
- Sign up in the EveryInfra console and get an API key. Follow the quickstart to put the key in the
EVERYINFRA_API_KEYenvironment variable. - Read the free catalog:
curl https://api.everyinfra.com/api/v1/social/catalog. Find the rows whereplatformistiktok, and readavailable,price_usdand the parameter notes. You can also try calls on the TikTok platform page and on each capability page, for examplemusic_chart. - Make one call by hand and make sure that you get 50 rows:
curl -X POST https://api.everyinfra.com/api/v1/social \
  -H "Authorization: Bearer $EVERYINFRA_API_KEY" -H "Content-Type: application/json" \
-d '{"platform":"tiktok","action":"music_chart","params":{"chart":"viral50"}}'- Save the Python script above as
tiktok_trends.py. Runpip install requests. Run the script two times, one hour apart. Read the changes in the second output. - Schedule it once per hour. To let an AI assistant query the data, connect the remote MCP server with the configuration above. The pricing page has prices and billing rules. The data market lists other ways to get similar data.
References
- Research Tools. TikTok for Developers. Read on 2026-11-14.
- Research API FAQ. TikTok for Developers. Read on 2026-11-14.
- Research API: Getting Started. TikTok for Developers. Read on 2026-11-14.
- Research API Reference: Query Videos. TikTok for Developers, 2026-09-01. Read on 2026-11-14.
- Research API Reference: Query User Info. TikTok for Developers, 2026-09-01. Read on 2026-11-14.
- Research API Reference: Query Video Comments. TikTok for Developers, 2026-09-01. Read on 2026-11-14.
- Research API Codebook. TikTok for Developers, 2026-09-10. Read on 2026-11-14.
- Vetted Researcher Data Access. TikTok for Developers. Read on 2026-11-14.
- Display API Overview. TikTok for Developers, 2026-08-04. Read on 2026-11-14.
- Display API: Get Started. TikTok for Developers, 2026-08-19. Read on 2026-11-14.
- API Reference: List Videos. TikTok for Developers. Read on 2026-11-14.
- Rate Limits. TikTok for Developers, 2026-08-04. Read on 2026-11-14.
- Scopes Overview. TikTok for Developers. Read on 2026-11-14.
- Login Kit Overview. TikTok for Developers, 2026-08-19. Read on 2026-11-14.
- Get Client Access Token. TikTok for Developers, 2026-11-05. Read on 2026-11-14.
- Commercial Content API. TikTok for Developers. Read on 2026-11-14.
- Commercial Content API: Getting Started. TikTok for Developers. Read on 2026-11-14.
- Commercial Content API Reference: Query Ads. TikTok for Developers. Read on 2026-11-14.
- Commercial Content API Reference: Query Advertisers. TikTok for Developers, 2026-09-01. Read on 2026-11-14.
- Commercial Content API: Supported Countries. TikTok for Developers, 2026-09-01. Read on 2026-11-14.
- Data Portability API. TikTok for Developers. Read on 2026-11-14.
- Data Portability API: Get Started. TikTok for Developers, 2026-09-10. Read on 2026-11-14.
- Changelog. TikTok for Developers, 2026-08-25. Read on 2026-11-14.
- TikTok One Creative Suite: Trends. TikTok for Business. Read on 2026-11-14.
- Terms of Service (US). TikTok USDS Joint Venture, 2026-07-15. Read on 2026-11-14.
- Terms of Service (global). TikTok. Read on 2026-11-14.
- Commercial Music Library. TikTok Help Center. Read on 2026-11-14.
- What's shaping the holiday season on TikTok Shop. TikTok Newsroom, 2026-10-13. Read on 2026-11-14.
- Black Friday 2026 bei TikTok Shop. TikTok Newsroom, 2026-11-05. Read on 2026-11-14.
- Veterans Day 2026: honoring #VeteransofTikTok. TikTok Newsroom, 2026-11-04. Read on 2026-11-14.
- TikTok LIVE Fest 2026. TikTok Newsroom, 2026-11-12. Read on 2026-11-14.
- Social data catalog. EveryInfra. Read on 2026-11-14.
- tiktok-api topic. GitHub. Read on 2026-11-14.
- TikTok-Api releases. GitHub, 2026-04-01. Read on 2026-11-14.
- Issue #1311: 200 empty body response for user-level queries. GitHub, 2026-07-18. Read on 2026-11-14.
- TikTokApi 7.3.3. PyPI, 2026-04-01. Read on 2026-11-14.
- sqlite3: DB-API 2.0 interface for SQLite databases. Python documentation. Read on 2026-11-14.
- Requests: HTTP for Humans. Requests documentation. Read on 2026-11-14.
- Model Context Protocol: Transports. Model Context Protocol, 2025-06-18. Read on 2026-11-14.
- Regulation (EU) 2022/2065 (Digital Services Act). EUR-Lex, 2022-10-19. Read on 2026-11-14.
- Delegated act on data access under the Digital Services Act. European Commission, 2025-07-02. Read on 2026-11-14.
- New measures unlock access to data from largest online platforms. European Commission, 2025-10-29. Read on 2026-11-14.
- Social listening in infodemic management for public health emergencies: guidance on ethical considerations. World Health Organization, 2025-04-08. Read on 2026-11-14.
- Infodemic. World Health Organization. Read on 2026-11-14.
- Federal Holidays. U.S. Office of Personnel Management. Read on 2026-11-14.
- El Buen Fin. Profeco. Read on 2026-11-14.
- El Buen Fin 2026. Portal oficial de El Buen Fin. Read on 2026-11-14.
- 1 in 5 Americans regularly get news on TikTok. Pew Research Center, 2026-10-19. Read on 2026-11-14.
- Digital News Report 2026: Executive summary. Reuters Institute, 2026-06-16. Read on 2026-11-14.
Reference BL-149