Farm-to-Shelf Price Alerts: Testing Online Apple Prices
Can online grocery prices tell a grower-packer when the farm-to-shelf spread moves? We tested Amazon apple and avocado listings against USDA shipping-point and retail ad reports, and ran the same test on JD.com in China.
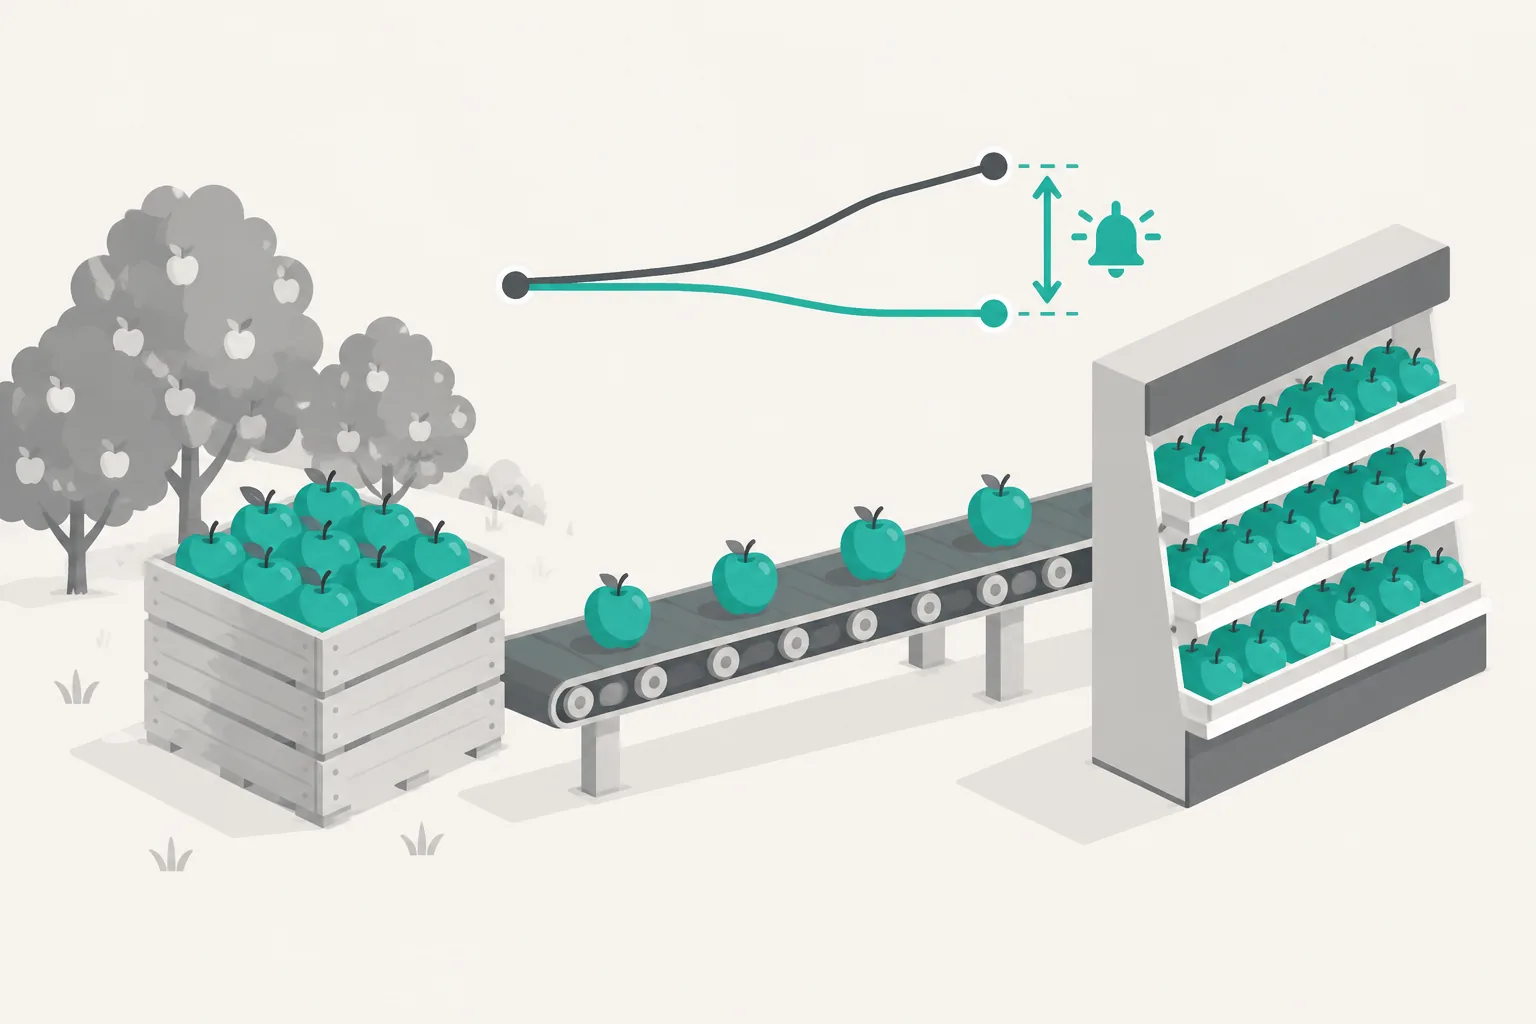
Online grocery prices can feed a farm-to-shelf spread alert, but only when you track the same product from the same seller every day. A keyword search average does not work. We tested this on October 24, 2026, 04:22–04:44 UTC, with 11 billed EveryInfra calls that cost $0.033751 in total. On Amazon, third-party sellers asked $8.00–$36.99 for a 3-lb bag of conventional Gala apples. The USDA retail ad average for the same pack was $3.69. Washington shippers sold it for about $2.08–$2.25.
In this article, a "spread alert" means one thing. You put one fruit on a four-step price ladder: shipping point, retail ad, first-party online price and third-party online price. Each week you calculate the ratio between the steps. You get an alert when a ratio moves outside its own history. The alert tells a seller which channel pays more this week. It is not a price forecast.


Who uses it: a grower-packer that also sells online
Our target customer is a small or mid-size grower-packer in a state such as Washington or New York. It sells most fruit through shippers and some fruit direct to consumers. In October, this business makes three decisions: sell now or store, sell through a shipper or online, and set the online price.
This season makes those decisions harder. USApple's Industry Outlook, published August 21, forecasts the 2026/27 U.S. crop at 263 million bushels, down 7% and 3% below the five-year average (USApple). It puts Washington at about 176 million bushels and New York at about 32 million. The Packer reported that Washington did not take part in the usual industry adjustment of the USDA estimate (The Packer, August 22). Early crop numbers are less certain this year, so weekly market prices carry more weight.
This is not the merchant tool in Price monitoring product: what merchants pay for and renew, which tracks competitor repricing. It is also not Inventory data for replenishment. Our user is the seller at the start of the chain. The question is how much each step adds.
The pass/fail rules we wrote first
We wrote three rules before we called any data:
- Unit price. We must get a price per pound for the same pack. Pass: at least 80% of priced rows show a weight.
- Noise. The price spread inside one comparable group must be smaller than the change we want to detect. Pass: the spread is less than 10 times the week-to-week change in the USDA reports.
- Order. The ladder must keep its order: shipping point ≤ retail ad ≤ online. Pass: no step is upside down.
Results: rule 1 passed. Rule 2 failed for search results. Rule 3 passed for third-party prices and failed for first-party prices, which were below the ad average. The data follows.
Test 1: a four-step price ladder for Gala apples
All prices are for conventional Gala in 3-lb bags unless we say otherwise.
- Shipping point. On October 19, Yakima Valley and Wenatchee shippers sold Gala at $24.95–$26.95 per carton (USDA National Apple Processing Report, page 2). Each carton holds 12 film bags of 3 lb, with fruit 2½ inches or larger. That is $2.08–$2.25 per bag. New York shippers asked mostly $26.00–$27.00 for the same carton, or $2.17–$2.25 per bag. These are open-market sales by first handlers, F.O.B. shipping point (USDA National Shipping Point Trends, October 20).
- Retail ad. On October 23, the USDA weighted average ad price for a 3-lb bag of Gala was $3.69 (USDA retail report). It counts 699 ads. The report covers ads that end between October 17 and October 29.
- First-party online. On October 24 at 04:33 UTC, we searched "fresh gala apples 3 lb bag" with Amazon Search API. We got 20 rows. Three priced rows came from Amazon's own stores. Honeycrisp 3 lb was $3.28 (list price $5.34). Organic Cosmic Crisp 48 oz was $8.99, and organic Granny Smith 3 lb was $7.99. The first-party Gala 3-lb listing showed no price, and its
in_stockvalue was false. We read it with no delivery address. - Third-party online. Five rows were conventional Gala in 3-lb or 48-oz packs from other sellers: $8.00, $15.00, $28.88, $36.99 and $36.99. The median is $28.88. Two of the $36.99 rows resold supermarket store brands.
From this ladder:
- The retail ad average is 1.64–1.77 times the Washington shipping-point price.
- The third-party median is 7.8 times the retail ad average and 12.8–13.9 times the shipping-point price.
- First-party Honeycrisp at $3.28 is 32% below the USDA ad average for Honeycrisp 3-lb bags, $4.79 in 350 ads.
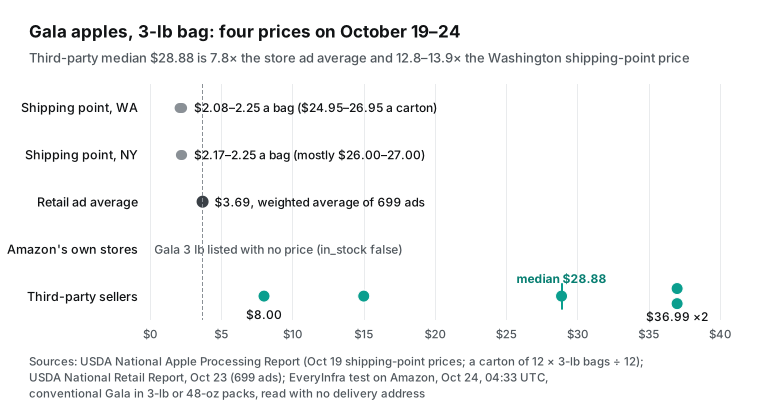
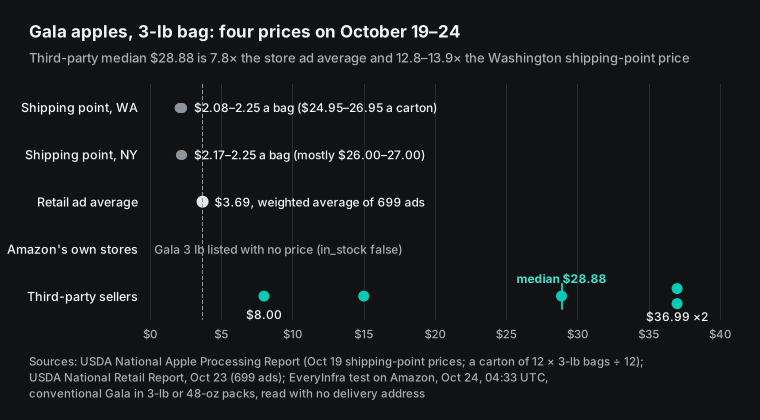
The third-party layer is a reseller market. It does not tell you what shoppers pay at a store. The first-party layer is closer to store prices, but it changes with stock and delivery address.
Test 2: even the USDA ad average moves with its sample
The same USDA report shows the noise problem in its own numbers. Last week, the Gala 3-lb bag ad average was $2.54 across 3,772 ads. This week it is $3.69 across 699 ads. That looks like a 45% rise in one week. But the number of ads fell by 81%. The stores that advertise changed, so the average changed.
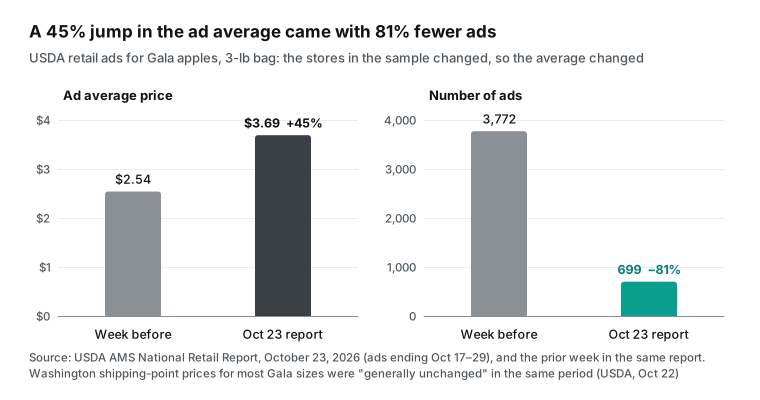
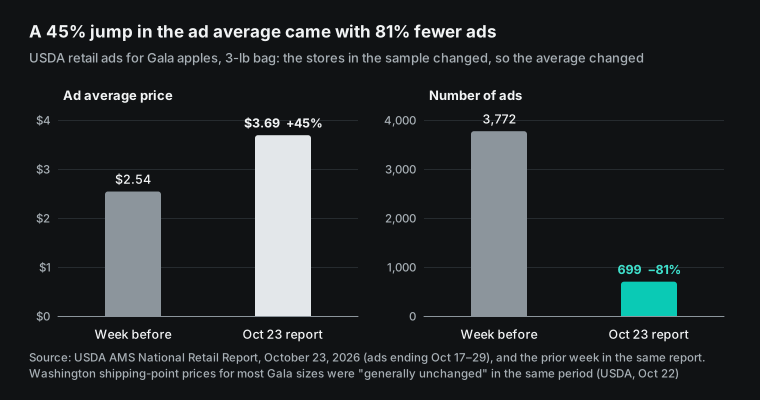
Washington shipping-point prices for Gala 100s were "higher" and other sizes "generally unchanged" in the same period (USDA, October 22). So the 45% move is mostly a sample effect, not a market move.
National statistics offices handle this with a fixed basket. The UK Office for National Statistics explains that its grocery scanner method follows the same products over time (ONS, fixed basket section). From March 2026, ONS uses about 300 million scanner price points per month for about half of the grocery market (ONS, January 2026). A spread alert needs the same rule: same product, same seller, same pack.
Test 3: the same test in China gave the same answer
We ran the same ladder for Fuji apples in China on the same day. The details are in our Chinese edition. In short:
- With JD.com All SKUs with Prices API, one 10-jin listing on JD.com returned 16 SKUs. Thirteen showed a net weight. Their price per kilogram ranged from CNY 17.78 to CNY 28.00 (about $2.65–$4.17 at the People's Bank of China central parity rate for October 23, 2026, CNY 6.7180 per USD), a 57.5% spread. Fruit diameter, pack size and courier choice caused most of it.
- For October 9–15, China's Ministry of Agriculture and Rural Affairs (MARA) reported Fuji at CNY 8.91/kg wholesale (about $1.33 at the same October 23 central parity rate; weekly report via Foodmate). That was 0.6% lower than the week before.
- So the spread inside one listing was about 96 times the weekly wholesale change. On October 23, the daily average for six monitored fruits was CNY 6.64 per kilogram, down 0.3% (MARA daily report).
- Apple futures in Zhengzhou fell nearly 7% on October 14. Analysts named a larger crop and weak demand after the holiday (Futures Daily, reposted by Securities Times).
- Online sales of farm products in China grew 12.6% in January–September (Ministry of Commerce, October 23). China's statistics bureau already collects some CPI prices from online stores, under a fixed person, place and time rule (NBS, September CPI notes).
The Zhengzhou Commodity Exchange delivers first-grade red Fuji of 80 mm or larger against its apple futures (ZCE rules, 2025). China's new national apple standard took effect on September 1, 2026 (GB/T 10651-2026). Both markets grade apples by size, so both need size-matched prices before any comparison.
Test 4: where online prices do match store ads
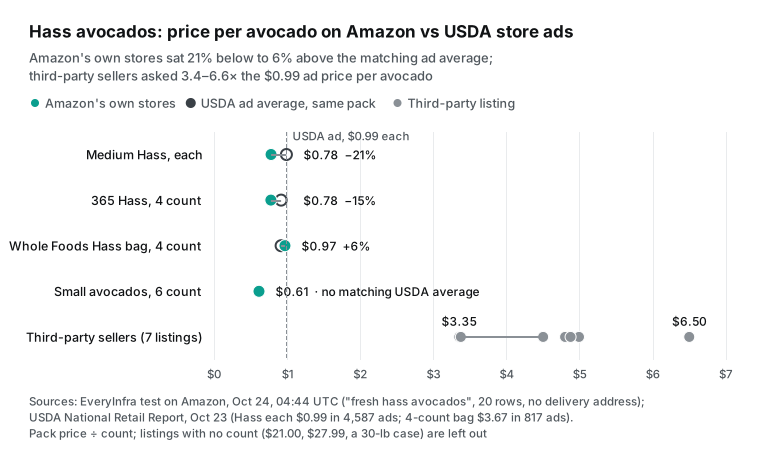
Avocados gave a better result. On October 24 at 04:44 UTC, we searched "fresh hass avocados" on Amazon and got 20 rows. Four first-party rows had prices:
- Medium Hass avocado, each: $0.78 (list price $1.69). USDA ad average for Hass, each: $0.99 in 4,587 ads.
- 365 by Whole Foods Market Hass, 4 count: $3.11. USDA ad average for Hass in 4-count mesh bags: $3.67 in 817 ads.
- Whole Foods Hass bag, 4 count: $3.88.
- Small avocados, 6 count: $3.69.
The first-party prices were 6% above to 21% below the USDA ad averages. Third-party rows asked $4.80 for one avocado, $25.99–$54.00 for packs of 4 to 16, and $69.00 for a 30-lb case. So the first-party layer can track store prices for a fruit that sells by count, with a fixed pack. Research supports this. Cavallo compared online and in-store prices at 56 large multi-channel retailers in 10 countries. Price levels were identical about 72% of the time (American Economic Review, 2017).
Can the signal be used?
Use it in three cases:
- Fixed first-party panel. Choose 20 ASINs from first-party sellers. Fix the pack and the delivery ZIP code. Read them every day and compare each with the weekly USDA ad average.
- Channel choice. The ladder shows how much a 3-lb bag gains from shipping point to shelf. Subtract your own packing, shipping and platform costs. The result shows whether direct sales pay.
- Reseller watch. If third-party sellers list your brand at 8 times the shelf price, your buyers may see that price. You can use that fact in a channel review.
Do not use it in five cases:
- Search-result averages. Test 1 had a 4.6-times spread among five third-party Gala rows.
- Rows with no price. Seven of 20 rows showed no price, and all seven had
in_stockfalse. - Mixed packs. "Each", "4 count", "32 oz" and "48 oz" are different units. Convert before you compare.
- Promotion weeks. Use the USDA ad count as a weight. A week with 699 ads is not the same sample as a week with 3,772 ads.
- Fruits without a USDA series. The retail report lists only items with enough ads. A specialty variety with few ads has no stable comparison.
What the product looks like
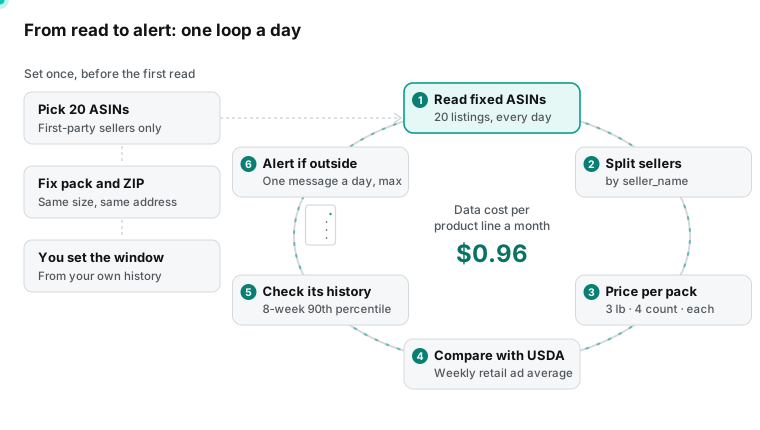
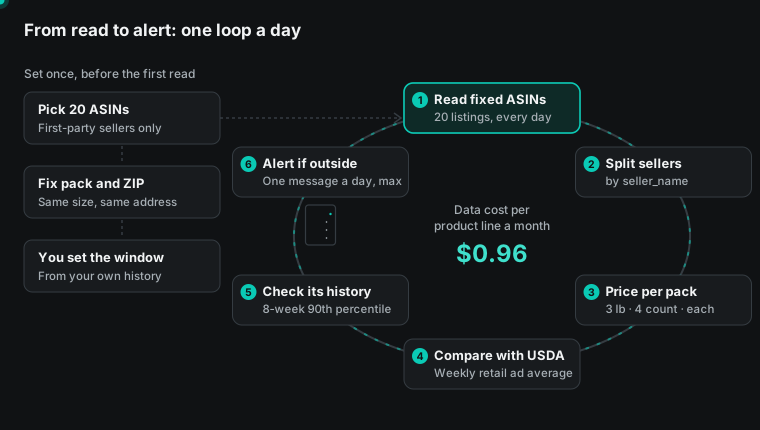
- Daily alert after the read. Send one message per day, but only in two cases. A fixed ASIN moves outside the 90th percentile of its last 8 weeks. Or a first-party row stays out of stock for 3 days. The grower-packer sets the window from its own history. We do not set business thresholds for the customer.
- Weekly spread brief on Friday. The USDA retail report comes out on Friday, and the shipping-point summary comes out earlier in the week. The brief shows the four-step ladder, 8-week ratios, the fixed ASIN table and three notes for next week.
- Monthly context. The USDA Economic Research Service updates its Food Price Outlook each month. The October edition says fresh fruit prices rose 2.0% from August to September 2026 (ERS Food Price Outlook).
Unit cost per month
At catalog prices read on October 24 (capability catalog, see pricing for current rates), one product line costs:
- Amazon search, 3 keywords per day: 3 × $0.001389 = $0.004167.
- Amazon product details, 20 fixed ASINs per day with Amazon Details API: 20 × $0.001389 = $0.027780. We did not call this capability in this test. The price is from the catalog.
- Daily total: $0.031947. For 30 days: $0.96.
Empty and failed calls are not charged. USDA reports are free.
Get the same data in code or an AI client
One curl call reads an Amazon search page. Replace <API Key> with your key.
curl -s https://api.everyinfra.com/api/v1/social \
  -H "Authorization: Bearer <API Key>" \
  -H "Content-Type: application/json" \
  -d '{"platform":"amazon","action":"search","params":{"keyword":"fresh hass avocados","limit":20}}'
The fields you need for a spread alert (they match response_fields in the catalog):
asin: the product ID. Use it for the fixed panel.priceandlist_price: the shown price and the list price.seller_name: the seller. Use it to split first-party from third-party rows.in_stock: false rows have no usable price.title: the pack size, such as "3 lb" or "4 Count", is in the title.rating_count: the number of ratings on the listing.
In Claude Code, create a key with the quickstart, then add the Remote MCP Server for Data from 90 Platforms. The command format follows the Claude Code MCP docs.
claude mcp add --transport http everyinfra https://api.everyinfra.com/mcp \
  --header 'Authorization: Bearer ${EVERYINFRA_API_KEY}'
Then ask: "Use everyinfra_call_api to search Amazon for fresh hass avocados. Keep rows where seller_name is Amazon.com. Compare each price with the USDA ad average of $0.99 each."
Errors and charges we saw in this test:
- Params outside the
paramsobject:missing_param, with a working example. No charge. - A missing
actionfield:validation_error. No charge. - A call longer than 85 seconds:
timeout. No charge. The message tells you to send"mode":"async"and read thejob_idlater. - An async job with an empty result: status
succeeded,refund_staterefunded. To audit each charge, see API billing reconciliation.
Other ways to build the ladder
- USDA reports only. Free and consistent. They give the shipping-point and retail-ad steps, but no online prices.
- Retail scanner data. The most complete source of what shoppers paid. It costs money and arrives later.
- Manual store checks. Cheap for a few stores. Hard to repeat with the same packs.
- Our method. Automatic reads of fixed listings, with raw responses kept for audit. It cannot see in-store promotions or loyalty prices.
Eurostat's guide for national statistics offices treats classification and data validation as a separate step in any web price project (Eurostat paper for UNECE). A 2026 study in Portugal labeled 100,000 scraped supermarket titles and trained models to sort them into consumption classes (Statistical Journal of the IAOS). The best model reached a macro-F1 of 94.00%. By 2010, the Billion Prices Project at MIT collected 5 million online prices per day (Journal of Economic Perspectives, 2016). They came from more than 300 retailers in 50 countries. All three tell the same story: online prices are useful after you match the products.
Recent changes (September–October 2026)
- October 23: USDA retail report. Total ads rose 24% to 327,596 from 265,062 the week before (USDA). More ads mean a different sample. Check the ad count before you read the average.
- October 14: September CPI. The BLS index for fruits and vegetables rose 0.5% in the month and 3.7% over 12 months (BLS). Purdue's Center for Commercial Agriculture wrote that food at home was flat and that September food price moves were commodity-specific (Purdue PAER, October 21).
- October: ERS forecast. ERS forecasts food-at-home prices up 2.3% in 2026 (ERS). Its September edition had put farm-level fruit prices 7.6% above a year earlier in August, as reported by Growing Produce (Growing Produce).
- September 29: NASS Agricultural Prices. The crop production price index rose 5.8% from July to August (NASS). Farm prices move separately from shelf prices, which is why a ladder needs both.
- October 2: FAO Food Price Index. It averaged 136.0 points in September, up 1.5% from August (FAO). The index covers traded commodities such as cereals and sugar, not fresh apples.
- October 22–23: avocado prices in Mexico. In early October, Mexico's consumer prices for fruits and vegetables were 11.05% above a year earlier (INEGI). On October 23, small avocado growers in Michoacán stopped harvest to protest low orchard prices (Respuesta). The Mexico City wholesale market quoted Hass at mostly MXN 310 per 9-kg box that day (SNIIM). Our Spanish edition builds the avocado ladder.
Limits of this test
- We tested one day, not an 8-week series. The ratios are a snapshot.
- Amazon prices depend on the delivery address. We read them with no address.
- USDA ad prices are advertised prices, not paid prices. The report says it "reflects prices advertised by major grocery retailers."
- A 2026 study of Huelva strawberries in Spain treats price observatories as a tool for farmers (Spanish Journal of Agricultural Research). That study is about forecasting. Our test is only about spread tracking.
- USDA's Foreign Agricultural Service reports that Mexican export avocados now come in 40s and 48s, 9 to 12 ounces each (FAS GAIN, March 12). Count-based packs hide this size change, so a per-pound conversion stays uncertain.
FAQ
What is the farm-to-retail price spread for apples? It is the gap between what a shipper gets and what a shopper pays. This week, a 3-lb bag of Gala sold for $2.08–$2.25 at Washington shipping points and averaged $3.69 in store ads. (The question comes from search suggestions for "farm to retail price spread apples".)
How do I compare USDA shipping-point prices with retail prices? Convert both to the same pack. A carton of 12 3-lb bags at $24.95 is $2.08 per bag. Then divide the retail ad price by that number. Use the ad count as a check on the sample. (The question comes from search suggestions for "usda shipping point price vs retail price".)
Why are apples so expensive on Amazon? Many rows are third-party resellers. In our test, five third-party Gala rows asked $8.00–$36.99 for 3 lb. First-party rows were close to store ads. (The question comes from search suggestions for "why are apples so expensive".)
Related reading
- Platform pages: Amazon Product & Reviews Data API, JD.com Scraper API
- Capability pages: Amazon Search API, Amazon Details API, JD.com All SKUs with Prices API, Amazon Reviews API
- Related articles: Amazon price tracking false positives: verify the offer, App store review analysis as a paid product
References
- USDA AMS, "Weekly Grocery Store Specialty Crops Feature Activity (National Retail Report)", October 23, 2026, https://www.ams.usda.gov/mnreports/fvwretail.pdf
- USDA AMS, "National Apple Processing Report" No. 7, with National Shipping Point Trends for apples, October 22, 2026, https://www.ams.usda.gov/mnreports/fvwaplproc.pdf
- USDA AMS, "National Shipping Point Trends", October 20, 2026, https://www.ams.usda.gov/mnreports/fvwtrds.pdf
- USDA NASS, "Agricultural Prices", September 29, 2026, https://esmis.nal.usda.gov/sites/default/release-files/796084/agpr0926.pdf
- USDA ERS, "Food Price Outlook – Summary Findings" (October 2026 forecast), https://www.ers.usda.gov/data-products/food-price-outlook/summary-findings
- U.S. Bureau of Labor Statistics, "Consumer Price Index – September 2026", October 14, 2026, https://www.bls.gov/news.release/cpi.nr0.htm
- Purdue Center for Commercial Agriculture, "The September 2026 CPI and PPI Reports", October 21, 2026, https://ag.purdue.edu/commercialag/home/paer-article/the-september-2026-cpi-and-ppi-reports-energy-drives-energy-not-grocery-prices
- Growing Produce, "By the Numbers: Latest Food Price Outlook for Fruits and Vegetables", October 2026, https://www.growingproduce.com/vegetables/by-the-numbers-latest-food-price-outlook-for-fruits-and-vegetables/
- U.S. Apple Association, "USApple Releases 2026 Industry Outlook Report", August 21, 2026, https://usapple.org/news-resources/usapple-releases-2026-industry-outlook-report
- The Packer, "2026 Apple Crop Down 7% as Forecast Reporting Evolves", August 22, 2026, https://www.thepacker.com/news/2026-apple-crop-down-7-forecast-reporting-evolves
- FAO, "FAO Food Price Index rises in September amid weather concerns and transport disruptions", October 2, 2026, https://www.fao.org/newsroom/detail/fao-food-price-index-rises-in-september-amid-weather-concerns-and-transport-disruptions/en
- USDA FAS, "Mexico: Avocado Annual" MX2026-0019, March 12, 2026, https://apps.fas.usda.gov/newgainapi/api/Report/DownloadReportByFileName?fileName=Avocado%20Annual_Guadalajara_Mexico_MX2026-0019.pdf
- SNIIM (Secretaría de Economía), wholesale prices for Hass avocado, October 23, 2026, http://www.economia-sniim.gob.mx/nuevo/Consultas/MercadosNacionales/PreciosDeMercado/Agricolas/ResultadosConsultaFechaFrutasYHortalizas.aspx?ProductoId=133
- INEGI, "Índice Nacional de Precios al Consumidor, primera quincena de octubre de 2026", October 22, 2026, https://www.inegi.org.mx/contenidos/saladeprensa/boletines/2026/inpc/inpc_1q2026_10.pdf
- Respuesta, "Paran corte de aguacate en varios municipios por precio bajo del fruto", October 23, 2026, https://www.respuesta.com.mx/noticias-principales/paran-corte-de-aguacate-en-varios-municipios-por-precio-bajo-del-producto/
- Alberto Cavallo, "Are Online and Offline Prices Similar? Evidence from Large Multi-channel Retailers", American Economic Review 107(1), 2017, DOI 10.1257/aer.20160542, https://www.aeaweb.org/articles?id=10.1257/aer.20160542
- Alberto Cavallo and Roberto Rigobon, "The Billion Prices Project: Using Online Prices for Measurement and Research", Journal of Economic Perspectives 30(2), 2016, DOI 10.1257/jep.30.2.151, https://www.aeaweb.org/articles?id=10.1257/jep.30.2.151
- Office for National Statistics, "Overview of how we use scanner data in consumer price inflation statistics", January 28, 2026, https://www.ons.gov.uk/economy/inflationandpriceindices/articles/overviewofhowweusescannerdatainconsumerpriceinflationstatistics/january2026
- Office for National Statistics, "How multilateral index methods help us understand grocery scanner data", January 28, 2026, https://www.ons.gov.uk/economy/inflationandpriceindices/methodologies/howmultilateralindexmethodshelpusunderstandgroceryscannerdata
- Eurostat (Belchev and Lamboray), "How to start with web scraping in the HICP: Evidence from EU member states", UNECE expert meeting, June 2021, https://unece.org/sites/default/files/2021-05/Session_2_Eurostat_Paper.pdf
- de Freitas Ulisses Machado et al., "Turning web data into official statistics: Classifying Portuguese retail products with NLP models", Statistical Journal of the IAOS, 2026, DOI 10.1177/18747655251414407, https://journals.sagepub.com/doi/abs/10.1177/18747655251414407
- Lucena-Cobos et al., "Predicting prices and boosting digitalization to reinforce the farmer position in the agrifood value chain: Huelva strawberry case, Spain", Spanish Journal of Agricultural Research, 2026, https://sjar.revistas.csic.es/index.php/sjar/article/view/21688
- China MARA wholesale price system, "Weekly wholesale market price report, October 9–15, 2026", reposted by Foodmate, https://fsc.foodmate.net/show.php?itemid=755036
- China MARA, "October 23 wholesale price 200 index", October 23, 2026, https://scs.moa.gov.cn/jcyj/202610/t20261023_6488883.htm
- National Bureau of Statistics of China, "September 2026 CPI", October 14, 2026, https://www.stats.gov.cn/sj/zxfb/202610/t20261014_1965477.html
- China Ministry of Commerce, "E-commerce development, January–September 2026", October 23, 2026, https://www.mofcom.gov.cn/syxwfb/art/2026/art_e97e3afba99f4754b68921a80754102b.html
- Zhengzhou Commodity Exchange, "Fresh apple futures business rules", August 29, 2025, https://www.czce.com.cn/cn/flfg/zcjywgz/pzxz/webinfo/2025/08/1750864742702425.htm
- Futures Daily via Securities Times, "Apple futures fall nearly 7%", October 14, 2026, https://www.stcn.com/article/detail/4218230.html
- SAMR and SAC, GB/T 10651-2026 "Fresh apple", published February 27, 2026, https://openstd.samr.gov.cn/bzgk/std/newGbInfo?hcno=4F23475019A21CF181FAF9D0F6E255C2
- Anthropic, "Connect Claude Code to tools via MCP", read October 24, 2026, https://code.claude.com/docs/en/mcp
- EveryInfra, capability catalog
GET /api/v1/social/catalog, read October 24, 2026 04:12 UTC, https://api.everyinfra.com/api/v1/social/catalog - China Foreign Exchange Trade System, authorized by the People's Bank of China, "RMB central parity rates, October 23, 2026" (USD 1 = CNY 6.7180), read October 24, 2026, https://www.chinamoney.org.cn/chinese/ccprnoticecontent/index.html?searchDate=2026-10-23
Reference BL-34